Department of Physics · UDESC
Talk · 2026

Talk

From the birth
to the death of stars

From a cold cloud of hydrogen to a white dwarf, a neutron star or a black hole — and the physics that decides which end it will be.

Rafael C. R. de Lima

Department of Physics·UDESC/CCT·Joinville, Brazil

MJ · MCh · MTOVthree masses decide the fate

Outline

Five parts, one life

I

The birth

Molecular clouds, the Jeans criterion and why a shrinking cloud ends up lighting up.

II

The life

Fusion against gravity, mass and lifetime, the H–R diagram and what happens when the hydrogen runs out.

III

Degenerate stars

Heisenberg and Pauli hold up what fusion no longer can — up to the Chandrasekhar limit.

IV

Neutron stars

Pulsars, magnetars, nuclear density and light that bends — with results from my own research.

V

Black holes

From Laplace to Schwarzschild, the horizon, time that freezes and the stars around Sgr A*.

I

Part one

The birth

A star is born when the gravity of a cold cloud overcomes the thermal motion of its own gas.

nebulaeJeans · 1902collapse and fragmentationblack bodyprotostars
“Cosmic Cliffs”, Carina Nebula · NASA, ESA, CSA, STScI · public domain

Molecular clouds

Where is a star born?
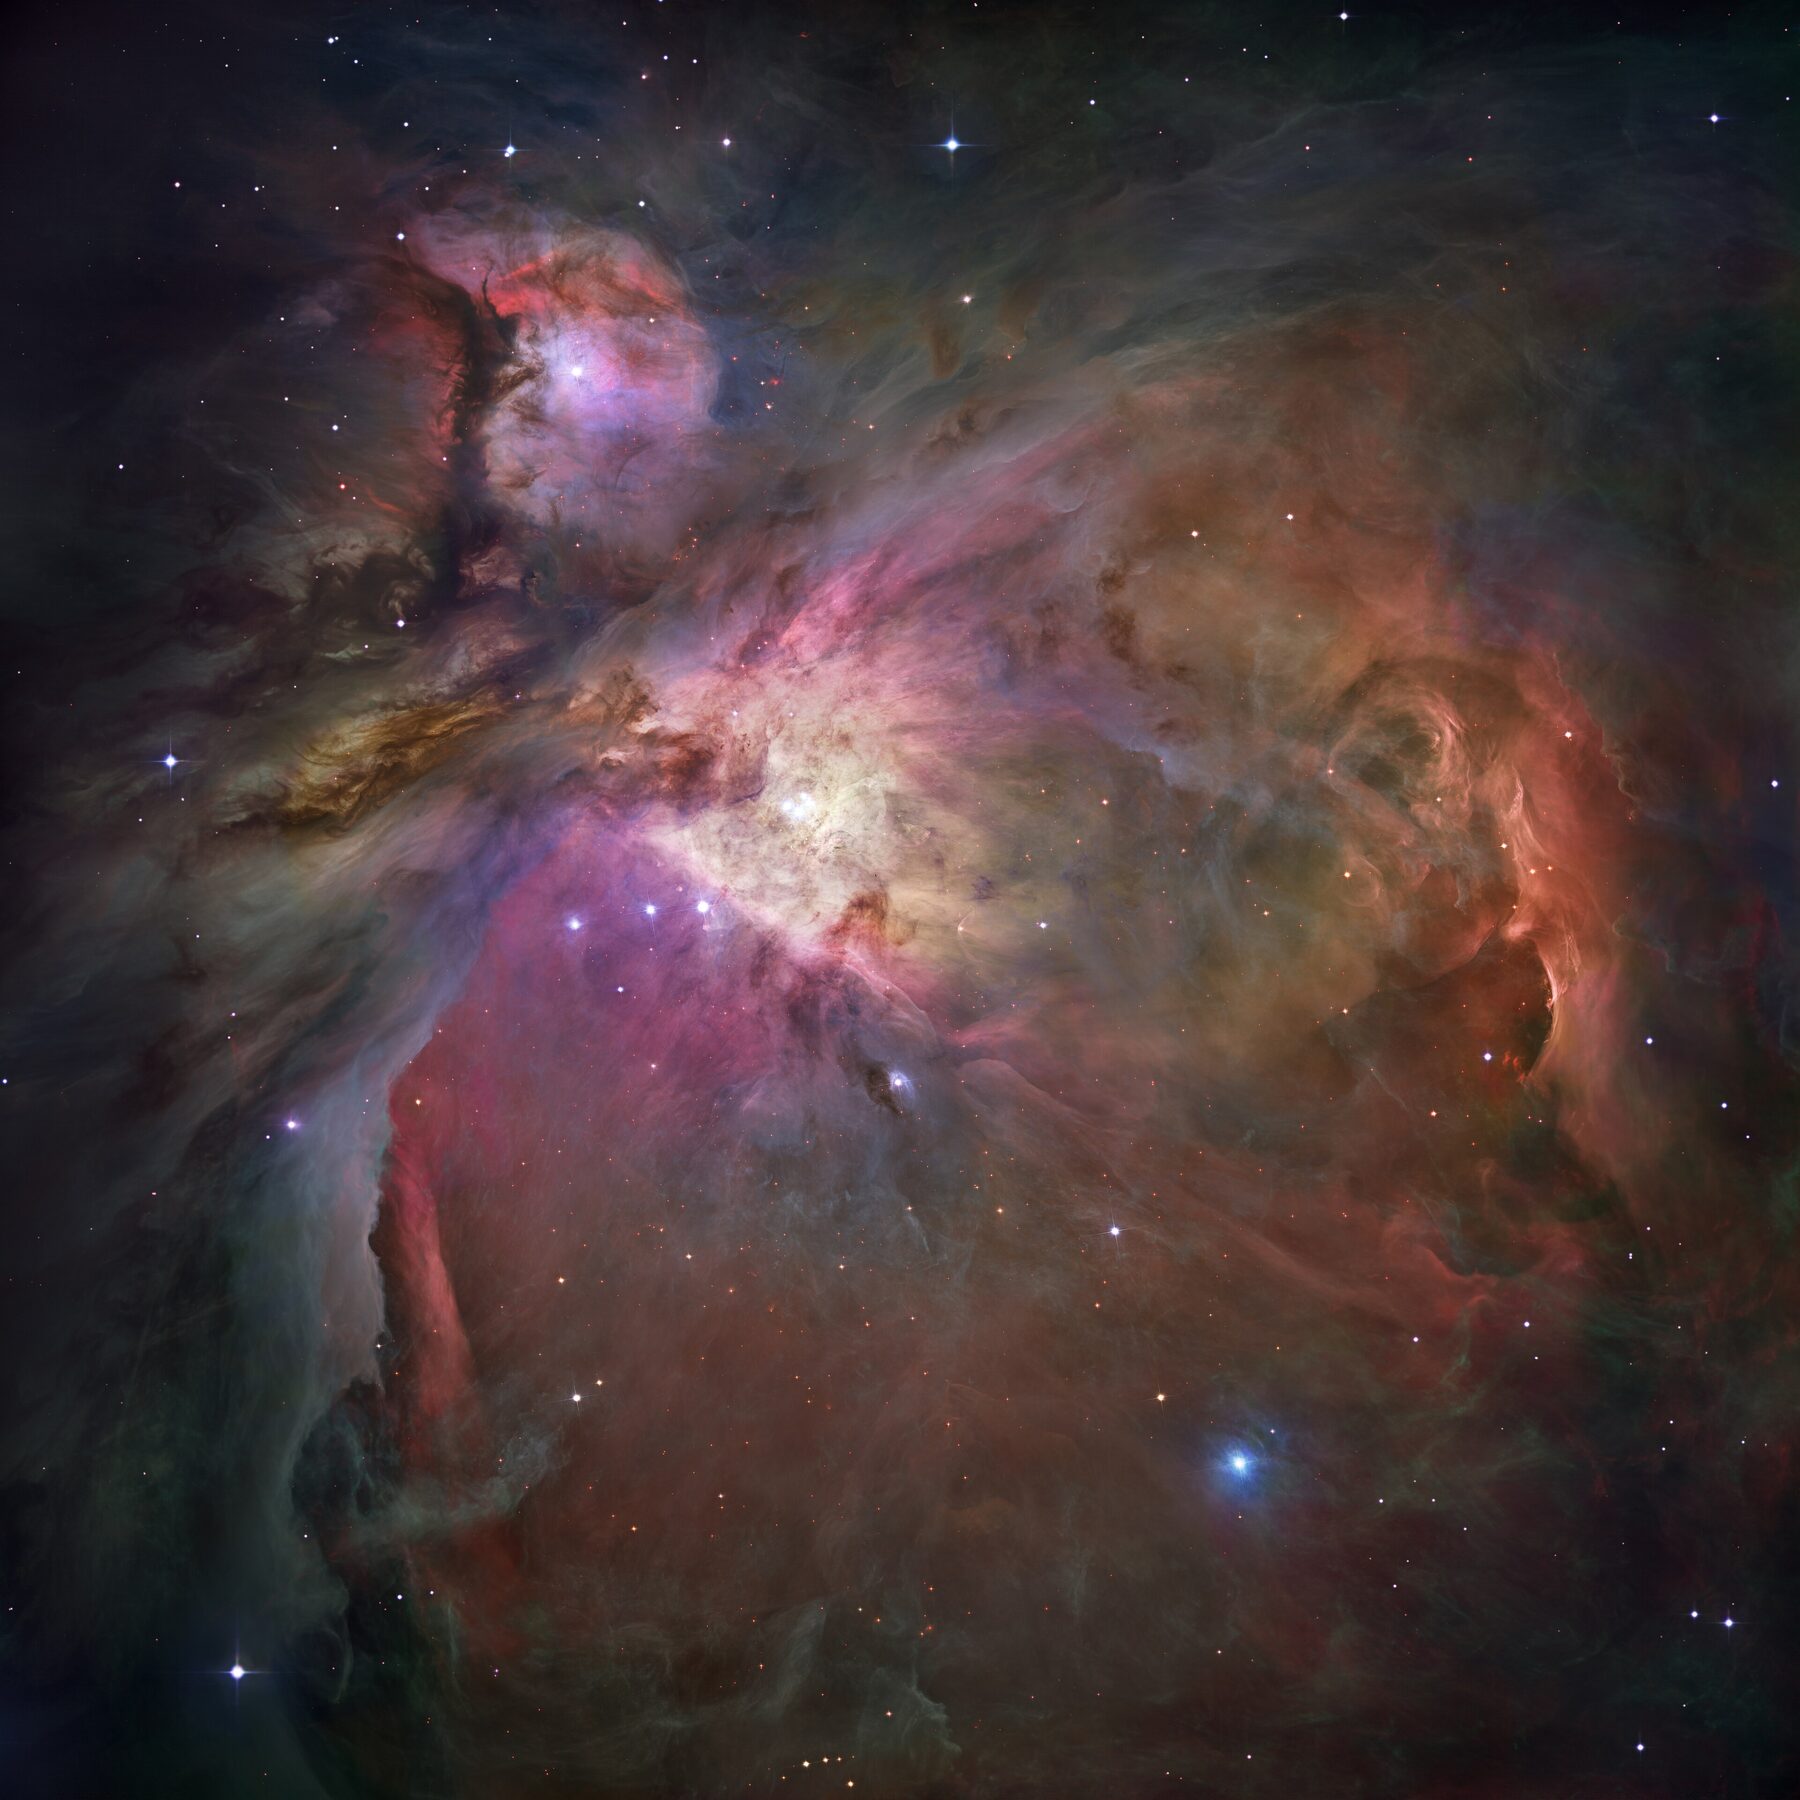
Orion NebulaNASA, ESA, M. Robberto · public domain

In nebulae: cold clouds of gas and dust.

  • Molecular clouds: the hydrogen is in molecules, H₂.
  • Dense enough for chemistry: H₂, carbon monoxide (CO), formaldehyde (H₂CO), water, alcohol…
  • Cold: 10 to 20 K, around −260 °C.

10–20 K

temperature

10²–10⁶

molecules per cm³

10⁶ M☉

up to this, in a giant cloud

Even the densest part is a better vacuum than any laboratory’s: the air we breathe has 2.5×10¹⁹ molecules per cm³.

Eagle Nebula · M16 · 7,000 light-years

The Pillars of Creation
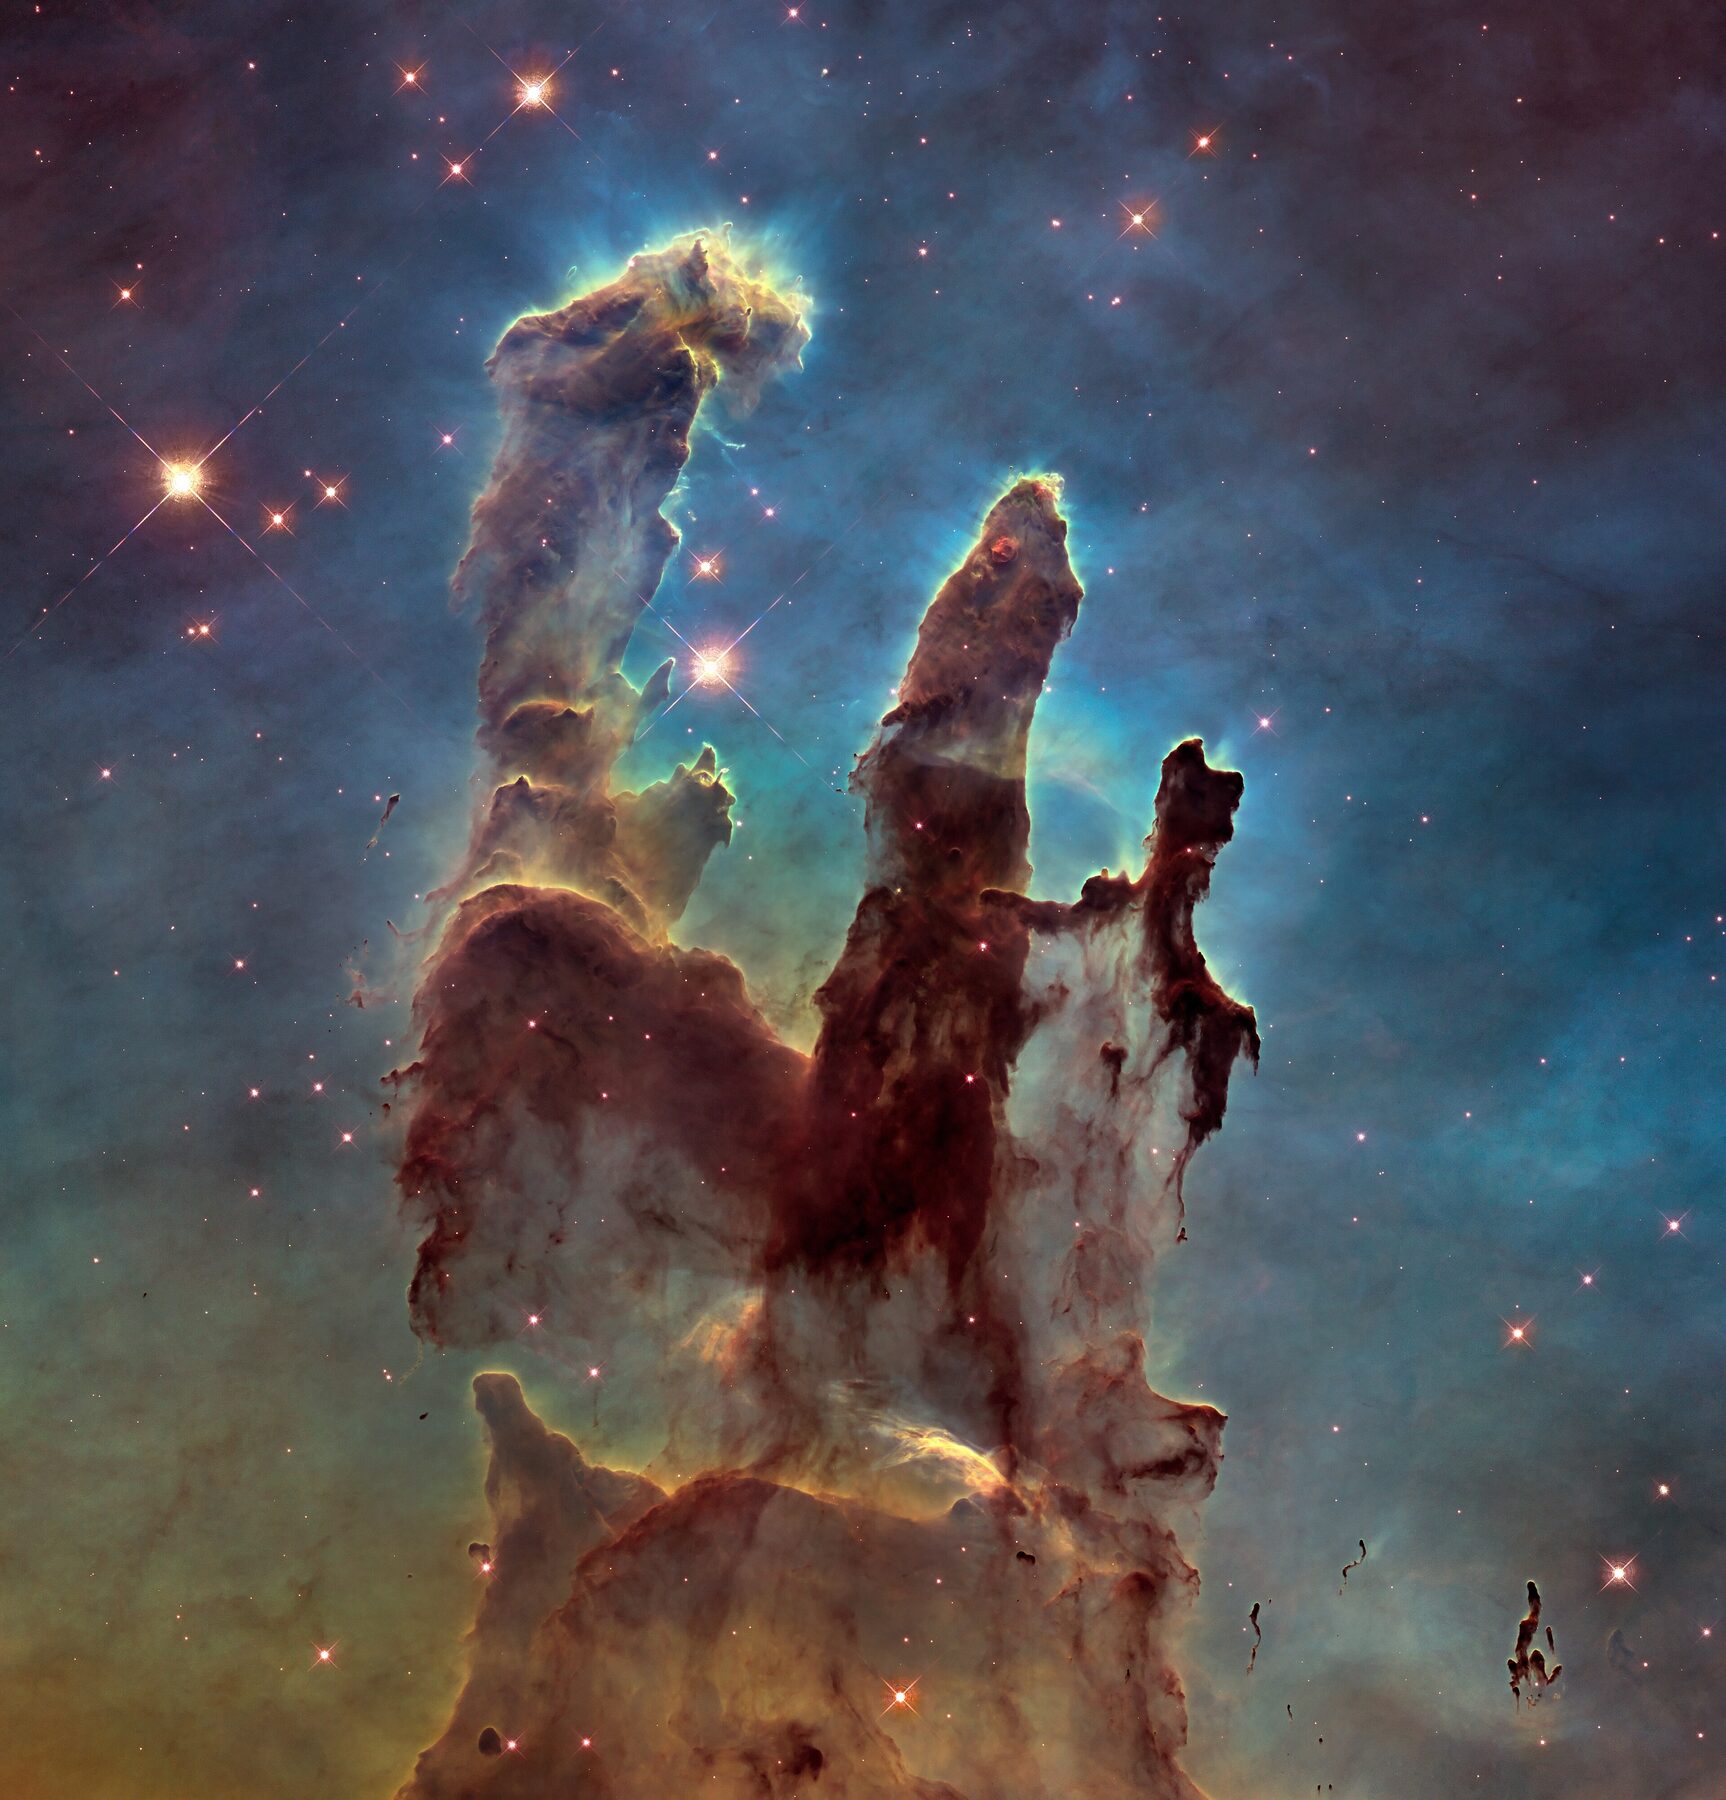
Pillars of Creation, Hubble, visible lightHubble · visible lightNASA, ESA, Hubble Heritage Team · public domain
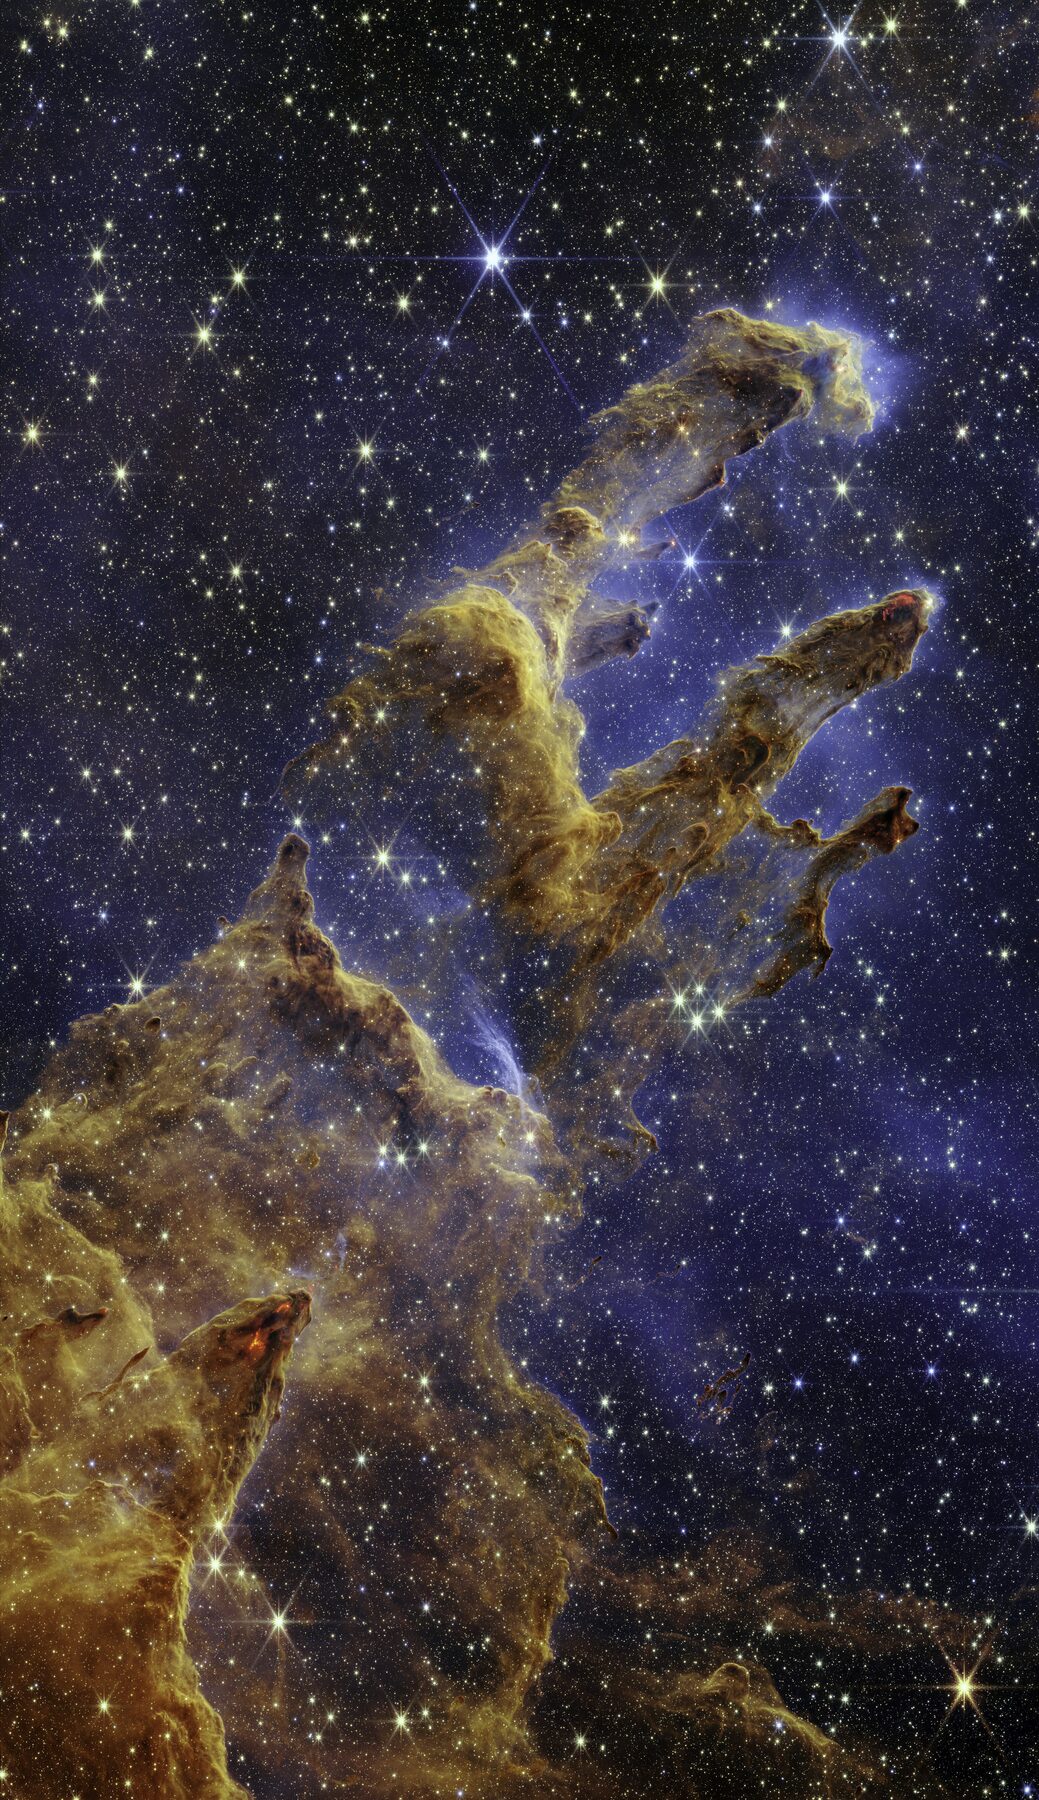
Pillars of Creation, Webb, infraredWebb · infraredNASA, ESA, CSA, STScI · public domain

Stars are being born in the pillars: the protostars.

In visible light the dust hides them. In the infrared it becomes transparent, and they show up as reddish dots at the tips of the pillars.

The left-hand pillar is about 4 light-years tall. Hubble: 1995, retaken in 2014. Webb: 2022.

Sir James Jeans · 1902

When does gravity beat heat?

The idea

A region of radius R and mass M collapses if its molecules, stirred by the cloud’s temperature T, are not fast enough to escape from it.

Then gravity beats the pressure that comes from thermal energy, and any disturbance makes the region fall in on itself.

It is the same escape-velocity sum that will come back in Part V — there, with light in place of the molecules.

Mean kinetic energy of a molecule of mass m, and its gravitational potential energy at the edge of the region:

Kavg = 32 kBT
UG = GMmR

The threshold for collapse is where the two are equal:

32 kBT = GMmR,   M = 4π3 ρR³

Solving for R:

R = 9 kBT8πGρm1/2

Jeans length and Jeans mass

The denser the cloud, the smaller the piece that collapses

In a more careful analysis, with pressure perturbations, Jeans found:

λJ = π kBTGρm1/2Jeans length
MJ = 4π3 λJ3 ρ = 4π5/23 kBTGm3/2 ρ−1/2Jeans mass
MJ ∝ T3/2 ρ−1/2

As the cloud collapses and gets denser, the mass that can collapse on its own decreases: the cloud breaks up into pieces — and each piece becomes a star. That is why stars are born in groups.

Jeans mass · H₂ gasdrag the controls

Collapse and fragmentation

From the cloud to protostars

illustration · gravity between 900 lumps of gas

The cloud falls in on itself. The densest regions collapse fastest — the free-fall time goes as ρ−1/2 — and the collapse fragments the cloud into several cores.

Each fragment spins faster and faster as it shrinks, like a skater pulling in her arms: it forms a disc, with a protostar at its centre.

Illustration, not simulation: particles with softened gravity and a little thermal motion, in a plane. Real gas has pressure, turbulence, magnetic fields and radiation — full simulations in Krumholz, Klein & McKee, ApJ 656, 959 (2007).

The difference is temperature

What is the difference between a cloud and a star?

Molecular cloud in OrionNASA, ESA, M. Robberto · public domain
Cloud · 10 K · shines in radio and infrared
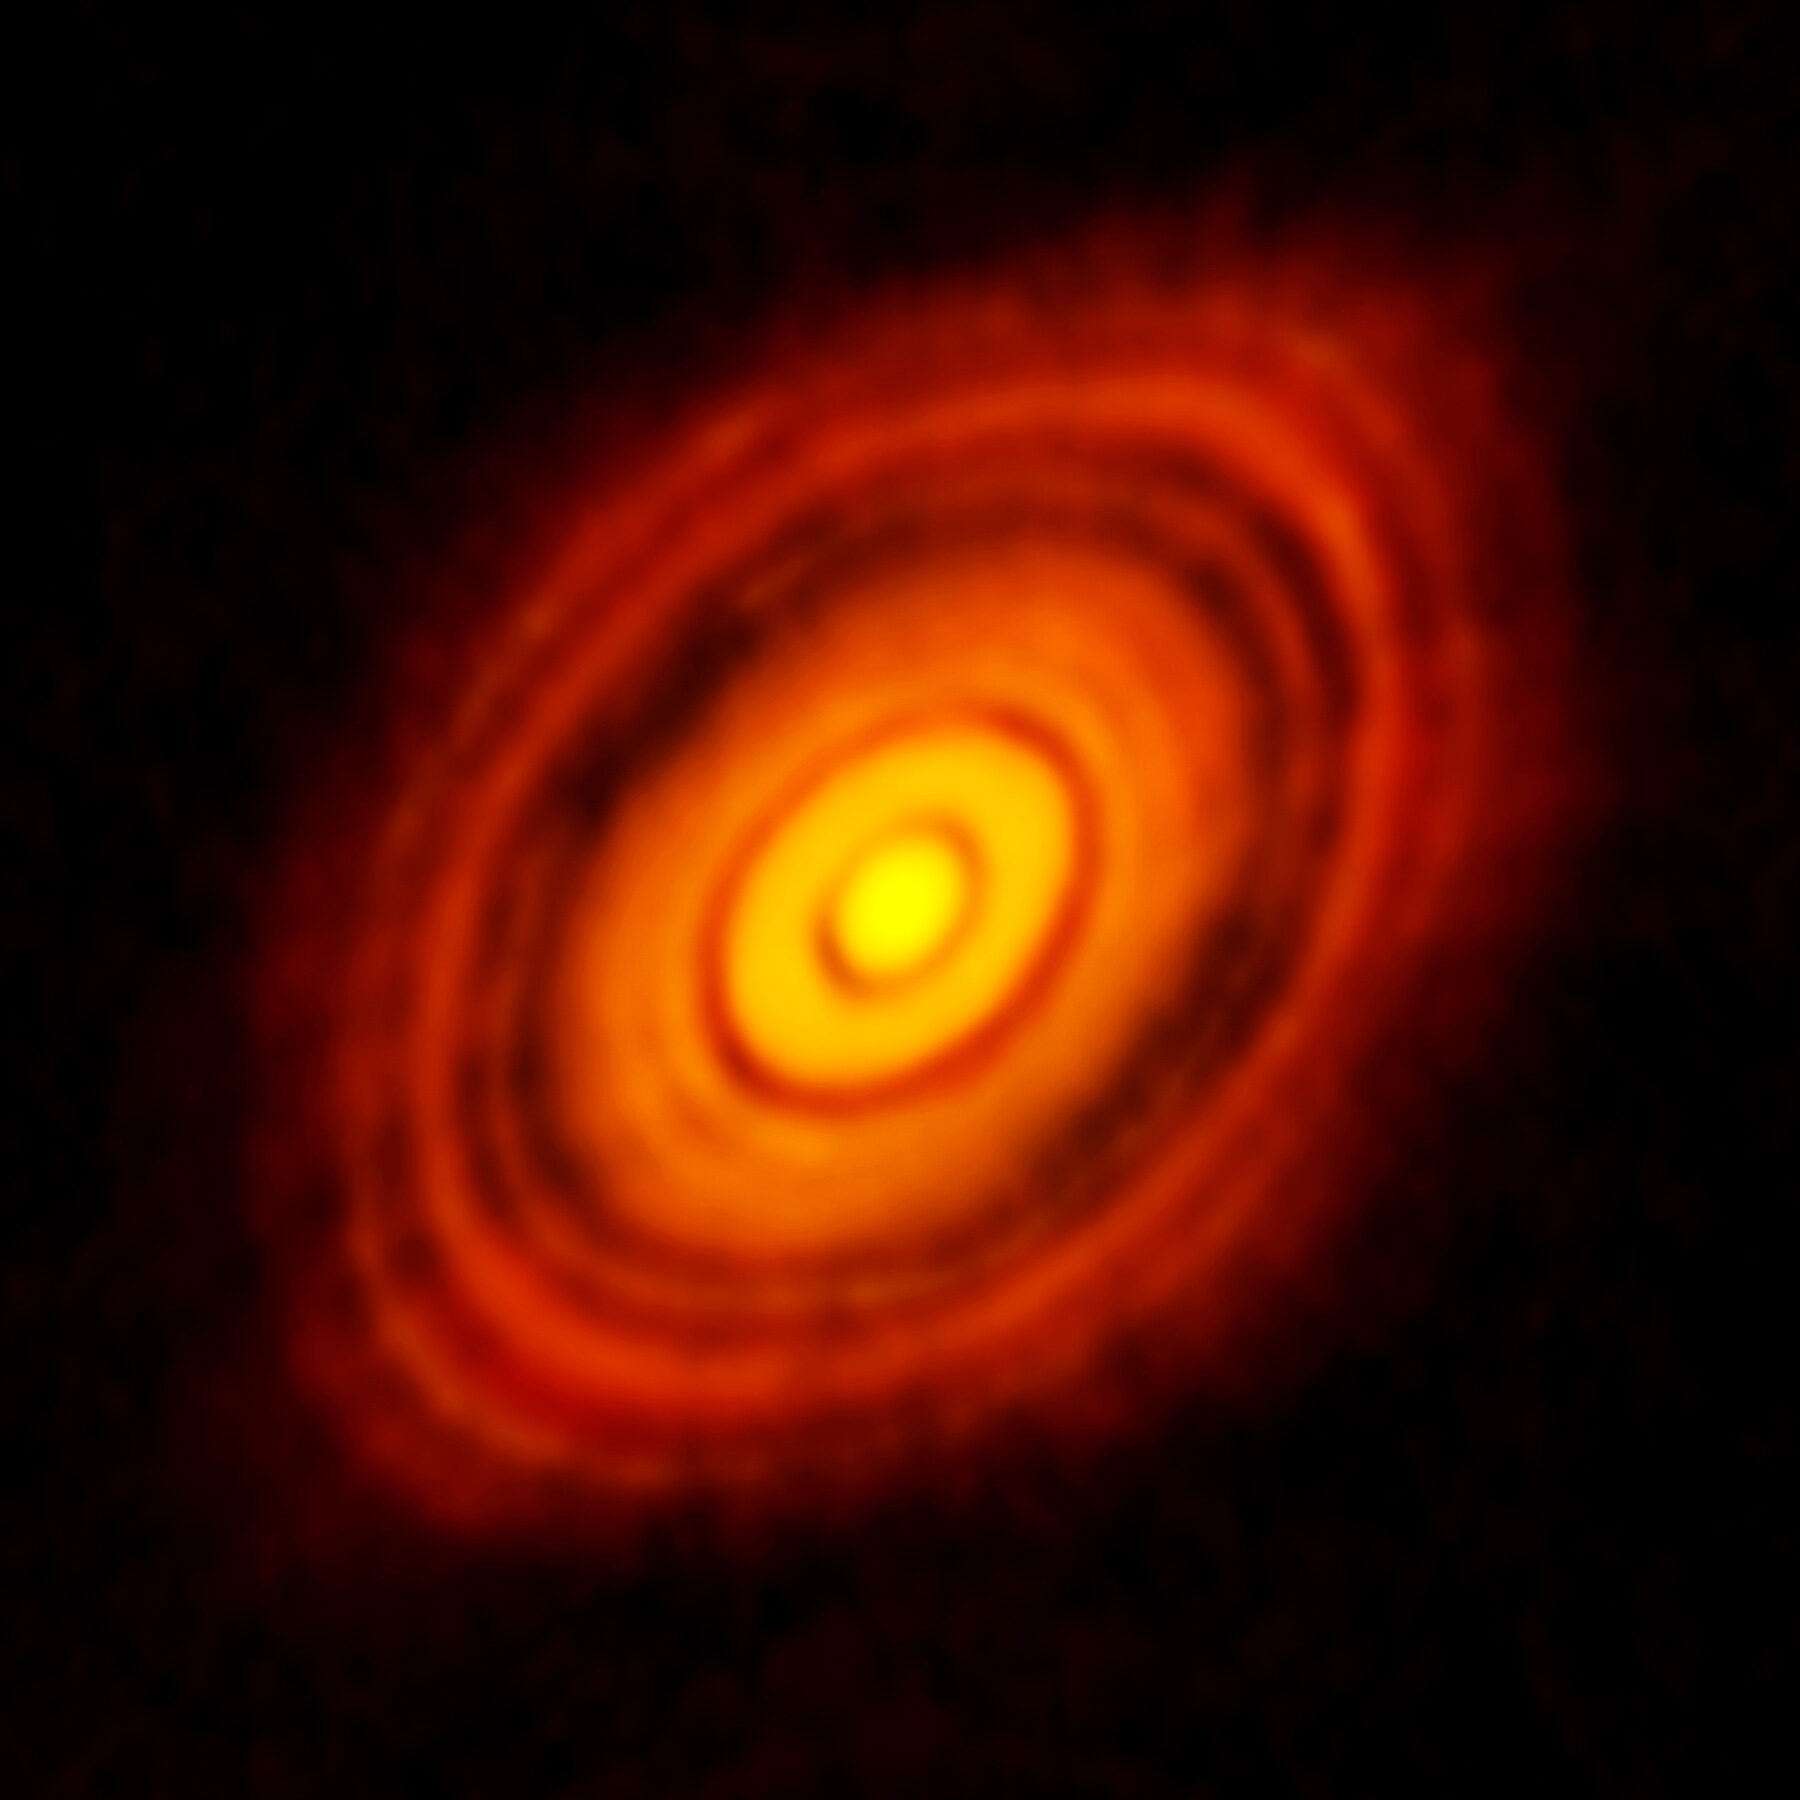
Disc around HL TauriALMA · CC BY 4.0
Protostar with a disc · HL Tauri · ~1 million years
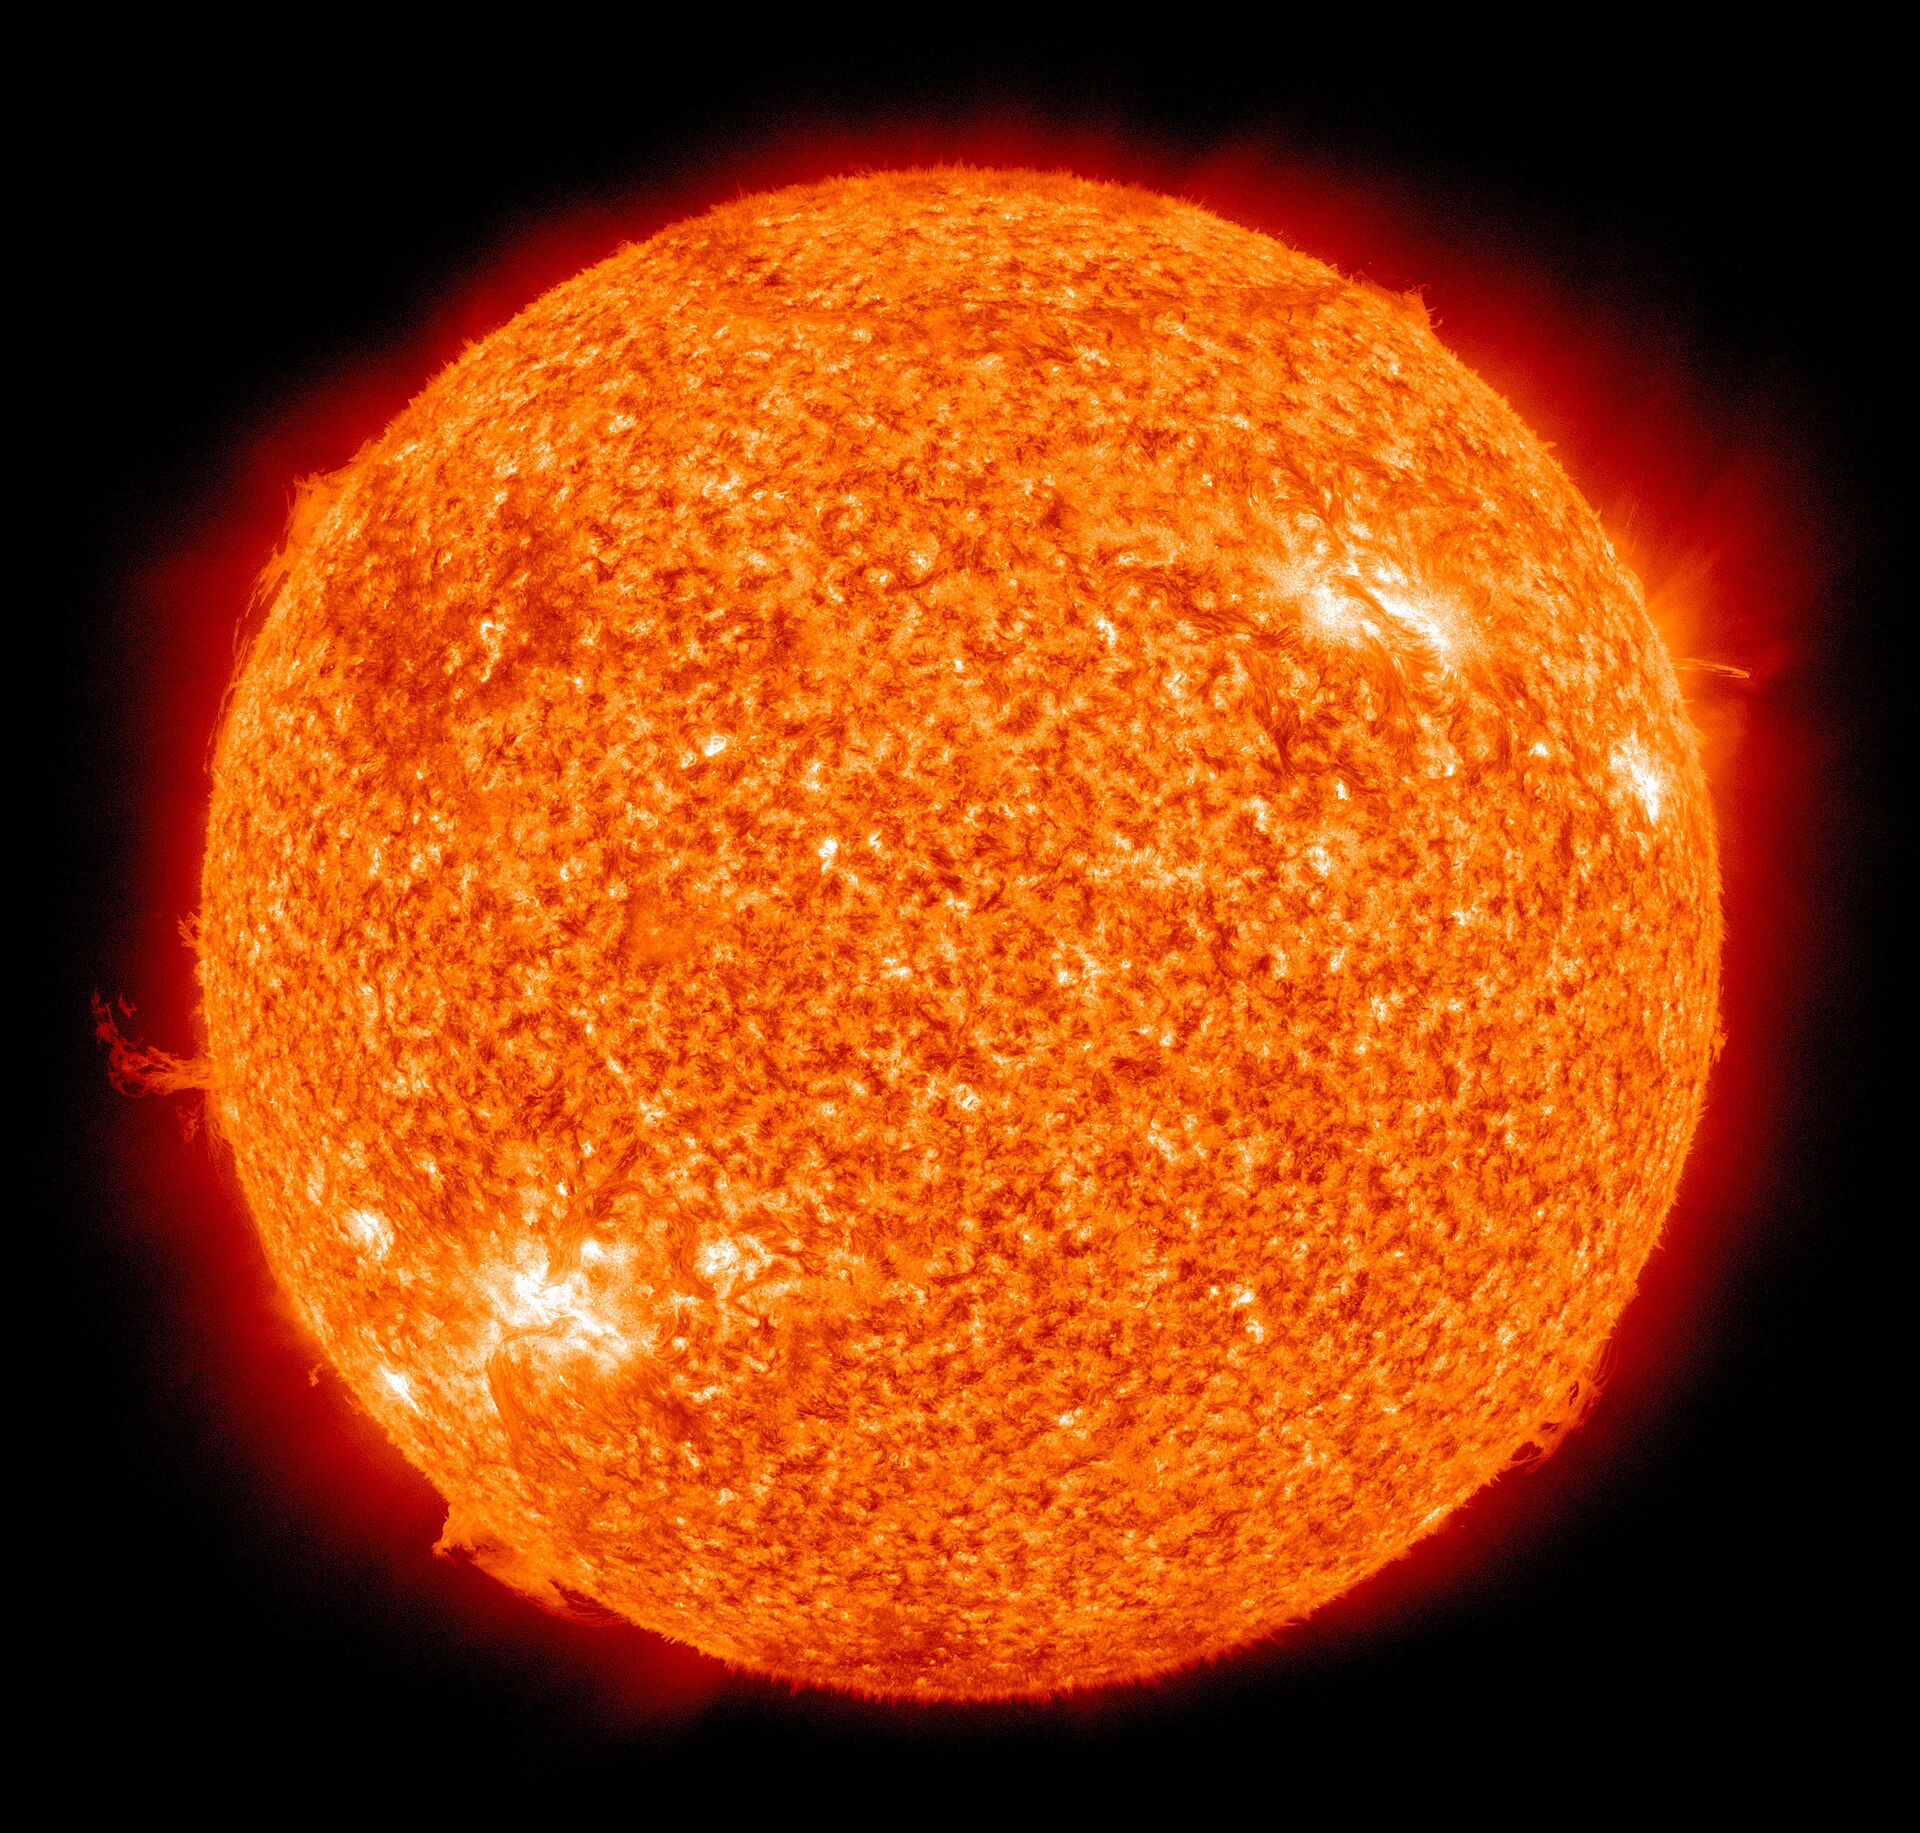
The SunNASA/SDO · public domain
Star · the Sun · 5,772 K at the surface, 15 million K at the centre
contraction→rising temperature→black body→visible light→a star is born!

Black-body radiation · Planck 1900

A star is a black body… almost

Bν(ν, T) = 2hν³c² 1ehν/kBT − 1Planck’s law
λmax = 2.898 mm·KTWien
L = 4πR²σT⁴Stefan–Boltzmann

The hotter the star, the bluer the peak and the far greater the brightness: doubling T multiplies the luminosity by 16.

The spectral classes O B A F G K M are a temperature scale: from over 30,000 K (blue) to under 3,700 K (red). The Sun is a G2.

“Almost”: the real spectrum has absorption lines from the elements in the atmosphere, and that is how we know what stars are made of.

black-body spectrum · colour of the stardrag the temperature

Hayashi · Henyey · 1961

From protostar to main sequence

  • The protostar starts as an invisible concentration of gas deep inside the cloud.
  • It contracts and heats up, hidden in a cocoon of dust: it only shows up in the infrared.
  • It blows the cocoon away and becomes visible, still shrinking: first almost straight down the diagram (the Hayashi track), then to the left (the Henyey track).
  • When the centre reaches ~10 million K, hydrogen starts to fuse: the star joins the main sequence and stops shrinking.

Schematic tracks, with key points roughly following Iben’s models (1965). The more massive the star, the faster: ~50 million years for 1 M☉, ~1 million for 5 M☉.

II

Part two

The life

Billions of years of balance between gravity, which crushes, and nuclear fusion, which pushes outwards.

hydrogen fusionhydrostatic equilibriummass and lifetimeH–R diagramred giants
The Sun (SDO) · NASA/SDO · public domain

What is a star’s life like?

Brightness, stability… and peace?

Brightness.

Stability.

Peace.

Not peace. At the centre of every star, non-stop, the reaction of a hydrogen bomb is going on.

The Sun

Proton–proton chain

The heart of a star is (literally) a hydrogen bomb
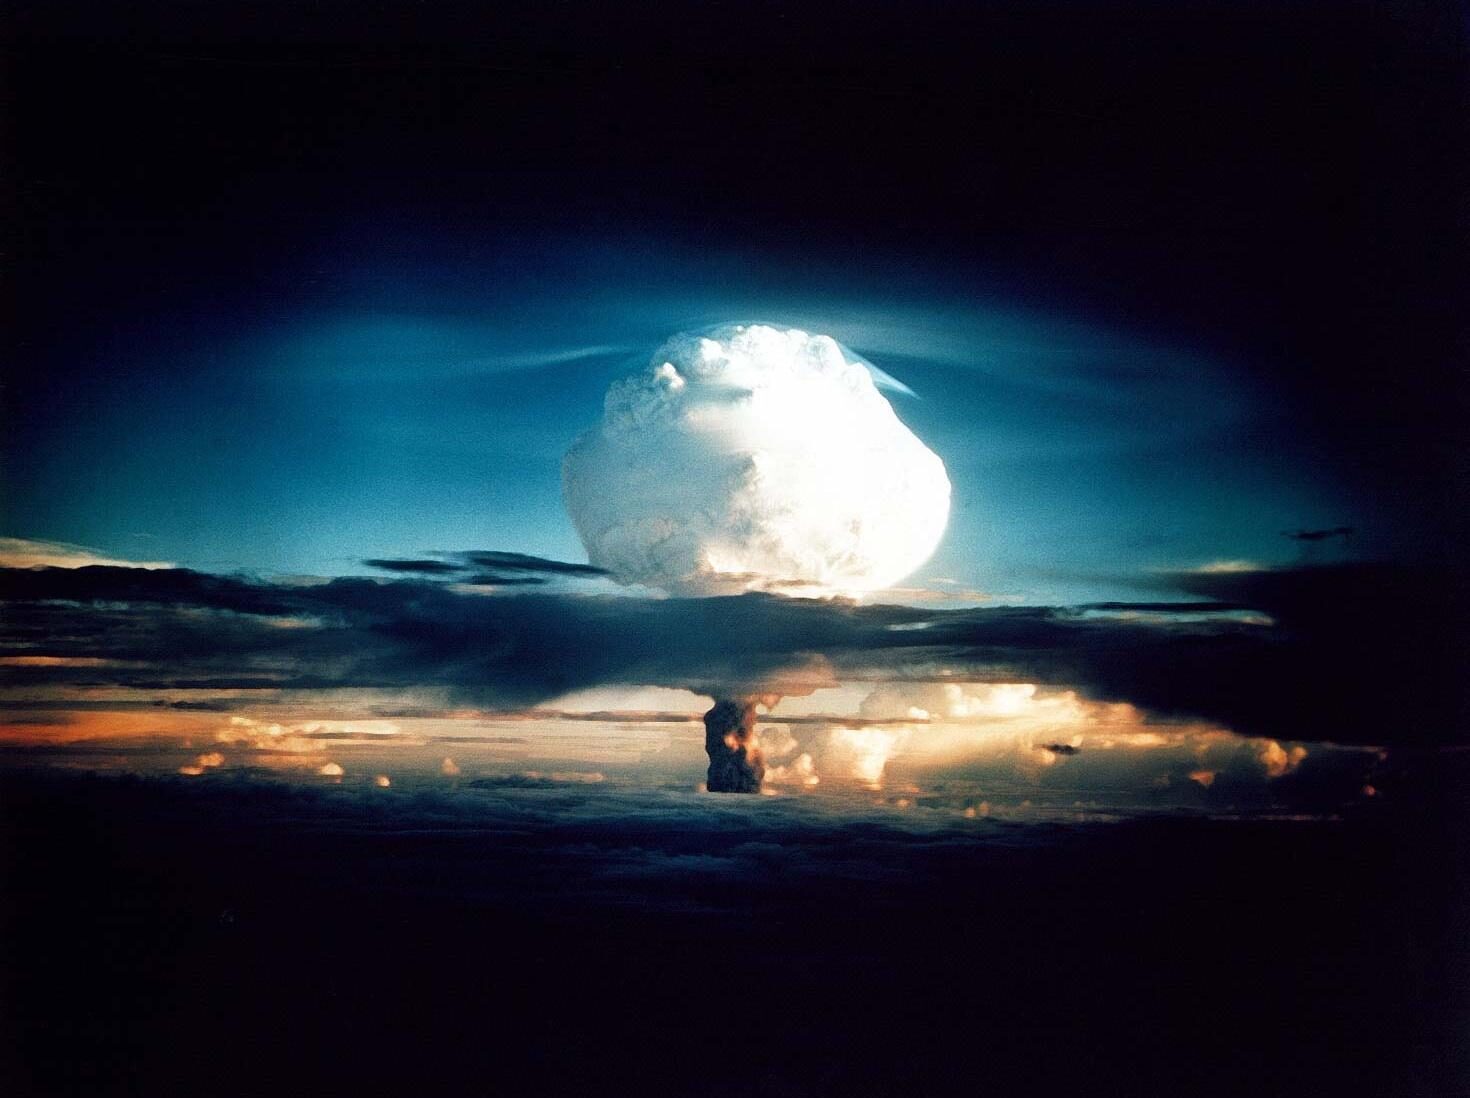
Ivy Mike nuclear test, 1952NNSA / Nevada Site Office · public domain
Ivy Mike, the first hydrogen bomb (1952): 10.4 megatons
¹H + ¹H → ²H + e⁺ + νe
²H + ¹H → ³He + γ
³He + ³He → ⁴He + 2 ¹H in total: 4 ¹H → ⁴He + 2 e⁺ + 2 νe + 26.7 MeV

Nuclear reactions keep up

  • the temperature — the black-body glow
  • the pressure that prevents gravitational collapse

Gravity keeps

  • the star together — the bomb does not fly apart
  • radiation trapped: a photon takes ~100,000 years to get out

610 million t/s

of hydrogen turn into helium

4.3 million t/s

of mass turn into light (E = mc²)

9×10⁹

Ivy Mikes per second

Hydrostatic equilibrium

A violent balance

dPdr = − G m(r) ρ(r)r²in every layer: pressure against weight

In every layer, the weight of everything above is held up by the difference in pressure. If the star shrinks, the centre heats up, fusion speeds up and the pressure pushes back; if it swells, it cools and fusion slows down. A thermostat.

centre of the Sunvalue
temperature15.7 million K
density150 g/cm³
pressure2.5×10¹⁶ Pa

Without pressure, the Sun would collapse in ~30 minutes — the free-fall time at its mean density.

Mass, luminosity and lifetime

More mass, shorter life

main sequencedrag the mass
L ∝ M3.5mass–luminosity relation (2 to 55 M☉)
t ≈ 1010 years · M/M☉L/L☉ ∝ M−2.5fuel ÷ burning rate

A 10 M☉ star has ten times more fuel, but shines thousands of times brighter: it lives ~30 million years. The Sun, ~10 billion. A red dwarf of 0.2 M☉, trillions — longer than the age of the Universe.

Every low-mass star ever born is still alive.

Hertzsprung · 1911 · Russell · 1913

The H–R diagram
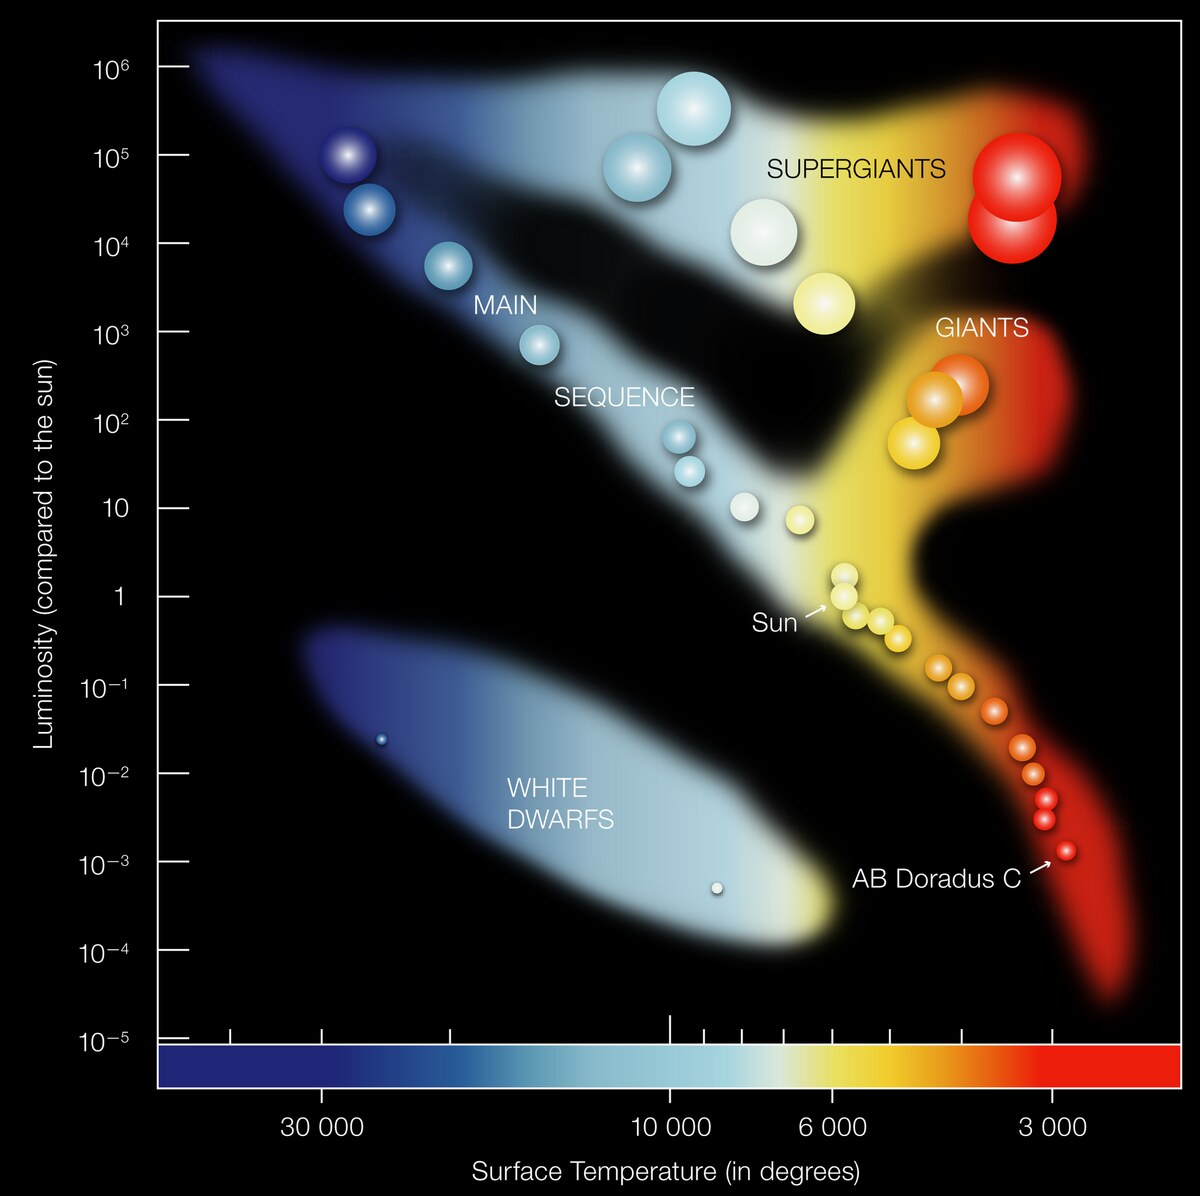
Hertzsprung–Russell diagramESO · CC BY 4.0

Temperature (or colour) on the horizontal axis, increasing to the left; luminosity on the vertical axis.

  • Main sequence: the diagonal, where stars spend 90% of their lives burning hydrogen in the core.
  • Giants and supergiants: cool and huge, top right.
  • White dwarfs: hot and small, bottom left.

When the star runs out of hydrogen in its core, little energy is left to support the weight of the layers above — 90% of the star.

When the core runs out of hydrogen

Three things at once

evolution on the H–R diagram · schematic

1 · Gravity starts to win

The helium core contracts, and the contraction relights hydrogen burning in a shell around it.

2 · The core heats up

Until another reaction ignites: ⁴He → ¹²C (triple-alpha, at 100 million K); in massive stars, ¹²C → ¹⁶O → … → ⁵⁶Fe, in shells like those of an onion.

3 · The outer layers swell

The energy pushes the envelope out: the star grows and cools — a red giant. Above ~8 M☉, a red supergiant.

And when the fire goes out?

Two paths, three fates
Molecular cloud
Molecular cloud10 K · millions of M☉
M ≲ 8 M☉
Sun-like starbillions of years
Red giant~100 R☉
Planetary nebula
Planetary nebulathe envelope drifts away
White dwarfthe size of the Earth
M ≳ 8 M☉
Massive starmillions of years
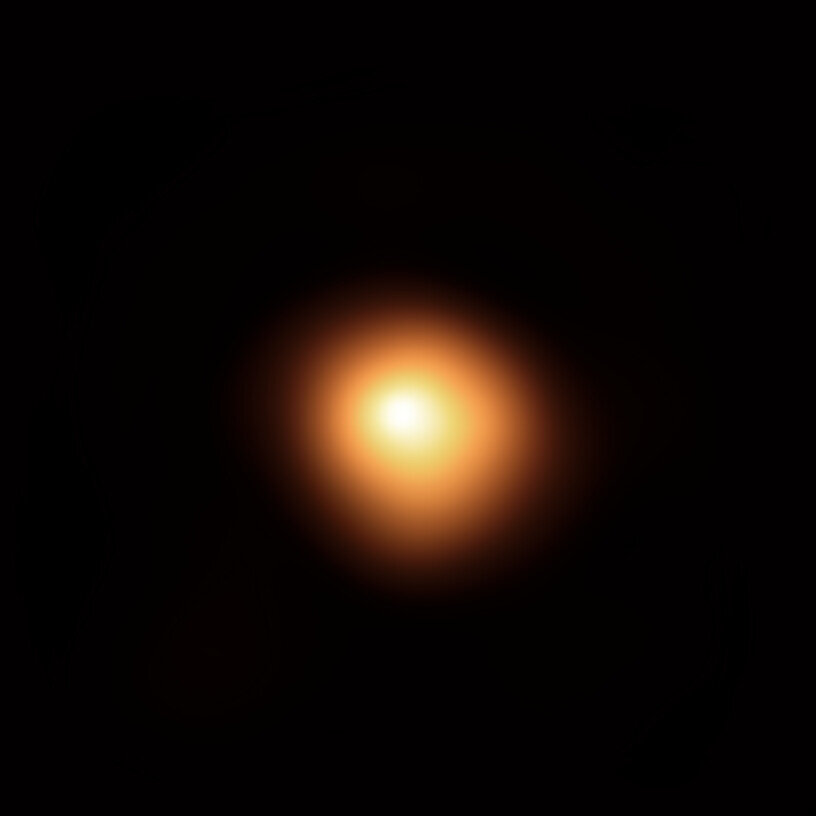
Betelgeuse
Red supergiant~1,000 R☉ · Betelgeuse
Supernova remnant
Supernovacore collapse
Crab NebulaM87*
Neutron star or black holeabove ~20–25 M☉: black hole

Gravitational collapse

When the fuel runs out

Without nuclear reactions, the pressure they kept up is gone: gravity wins and the star’s matter goes into free fall.

How long does it take?

tff = 3π32 G ρ1/2

At the Sun’s mean density, ~30 minutes. For the iron core of a massive star, ~0.1 s.

For some stars there is still a way out: degeneracy pressure.

III

Part three

Degenerate
stars

When fusion stops, what holds the star up is no longer heat: it is quantum mechanics.

white dwarfsHeisenberg · Paulidegeneracy pressureChandrasekhar limitcore collapse
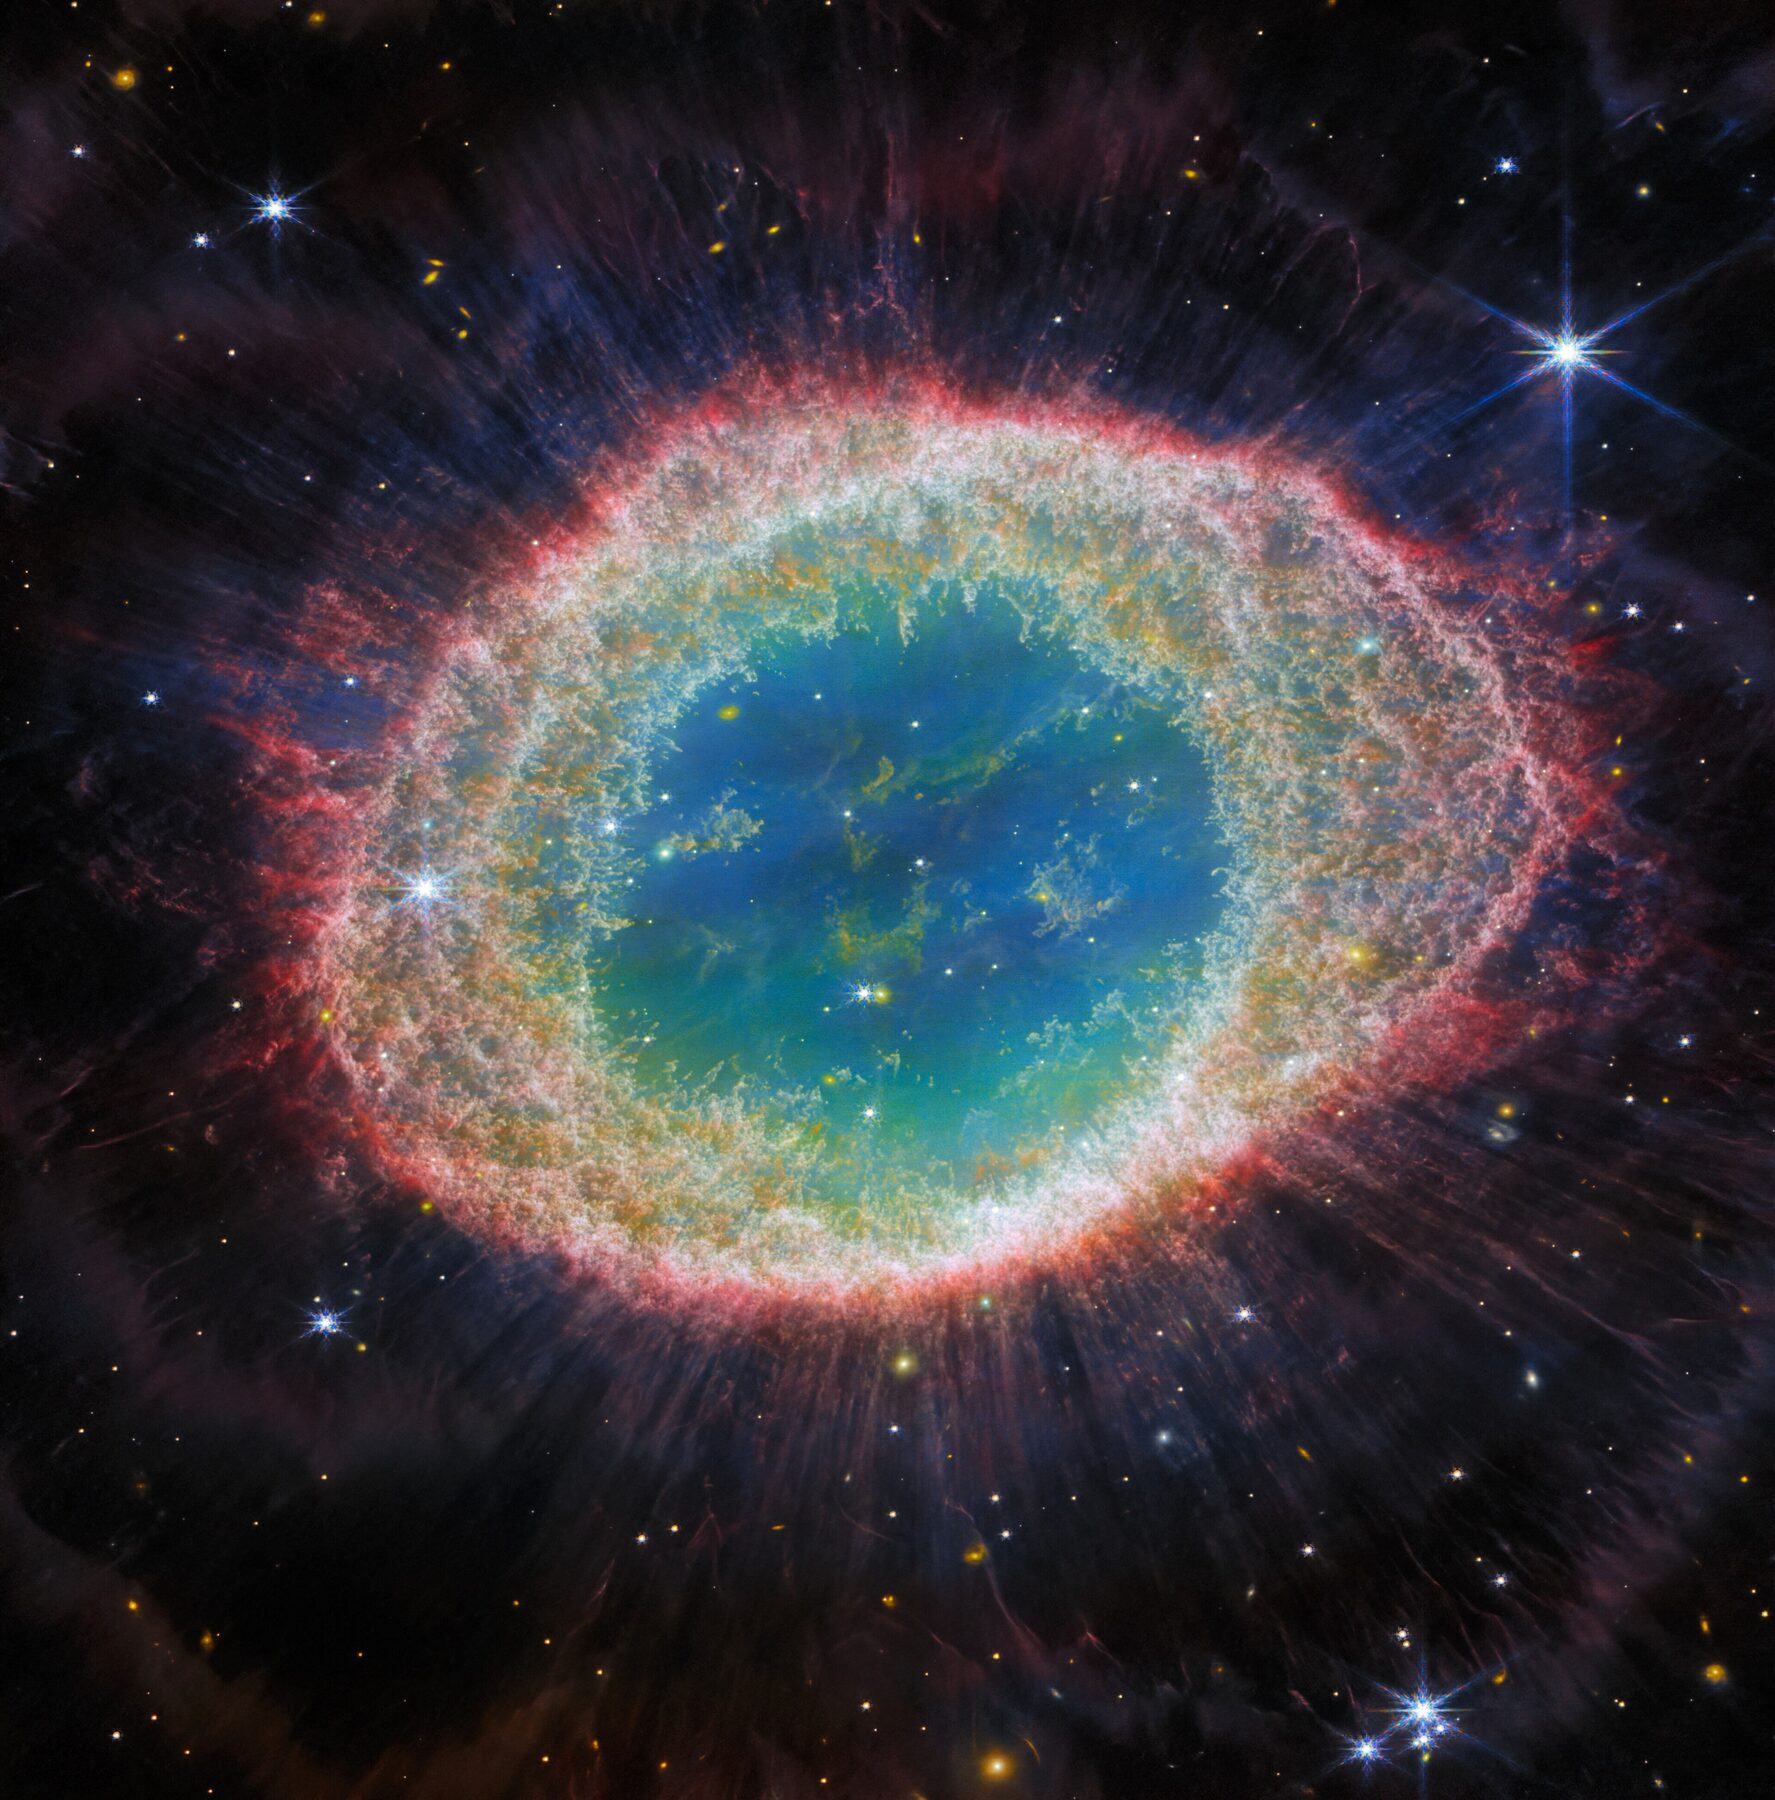
Ring Nebula (M57) · ESA/Webb, NASA, CSA, M. Barlow et al. · CC BY 4.0

Degenerate stars

The size of the Earth, or of a city

White dwarfs

Sirius B · R ≈ 5,600 km Earth · R = 6,371 km

R ≈ R⊕  ·  M ≈ M☉  ·  ρ ≈ 10⁶ g/cm³

A teaspoonful weighs ~5 tonnes. Held up by degenerate electrons.

Neutron stars
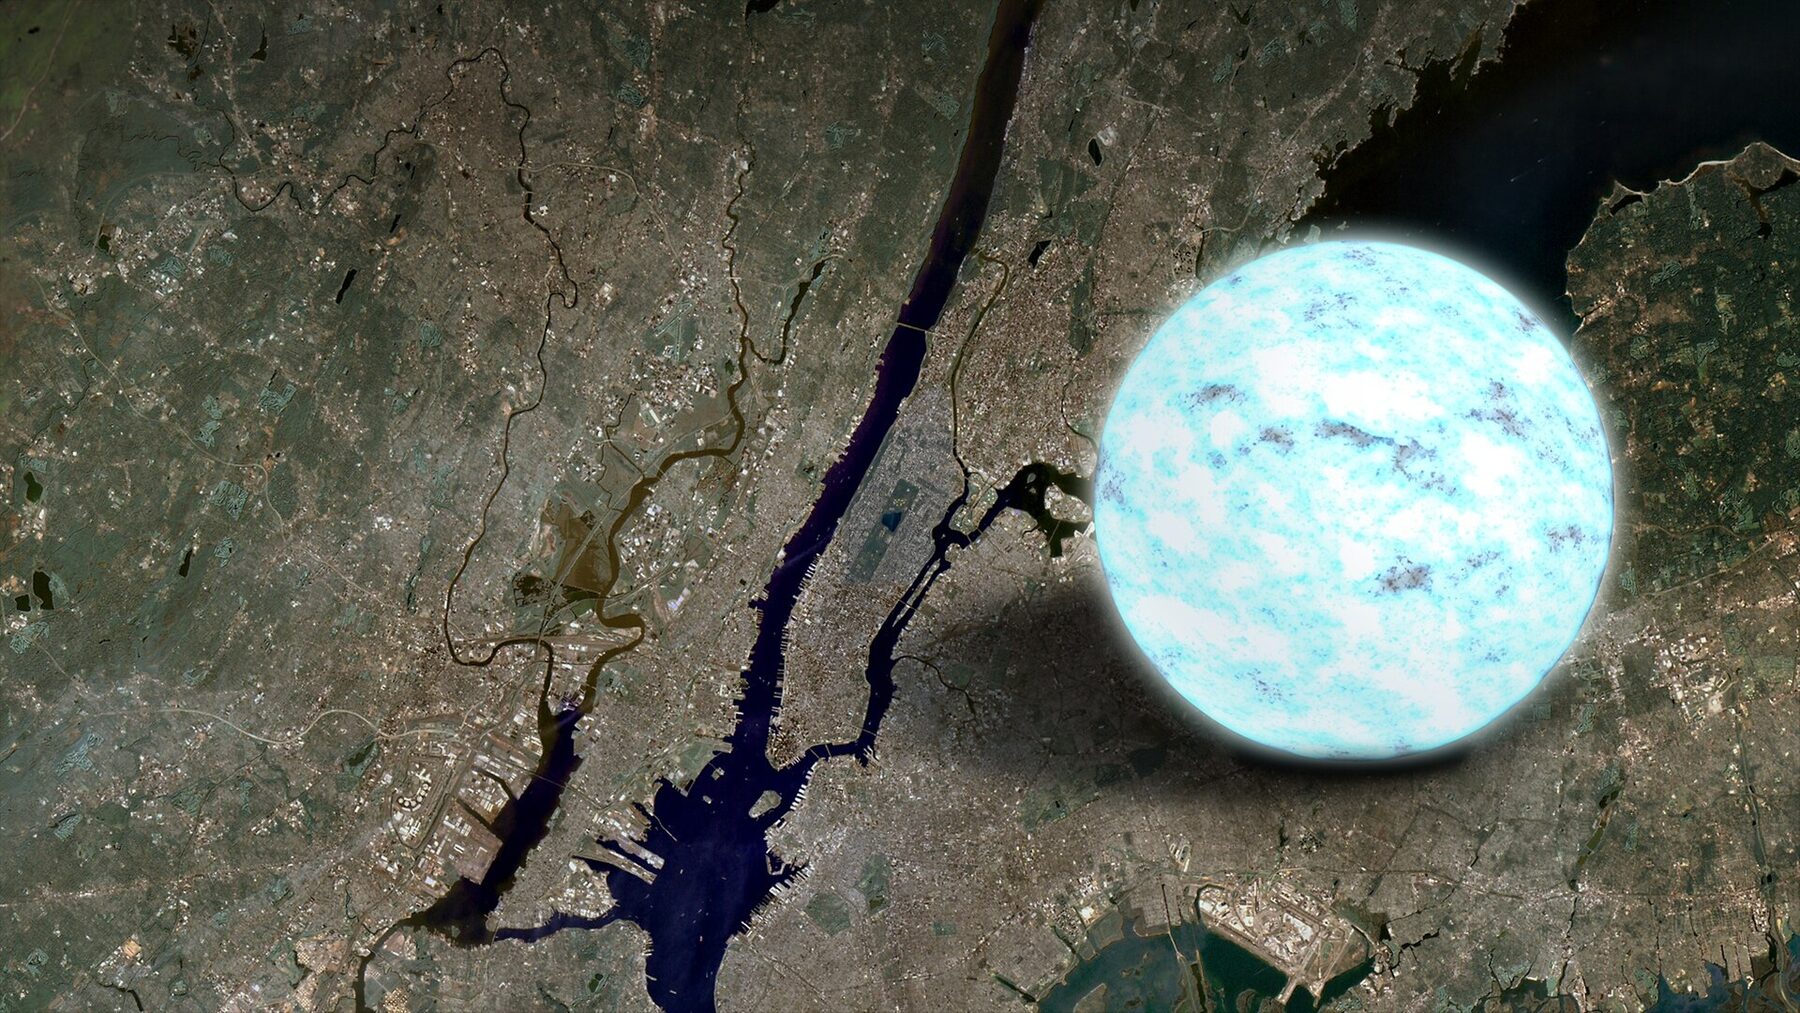
Neutron star over Manhattan, to scaleNASA's Goddard Space Flight Center · public domain

R ≈ 12 km  ·  M ≈ 1.4–2 M☉  ·  ρ ≈ 10¹⁴–10¹⁵ g/cm³

A teaspoonful weighs ~500 million tonnes. Held up by degenerate neutrons and the nuclear force.

Quantum mechanics · 1925 – 1927

Heisenberg and Pauli to the rescue
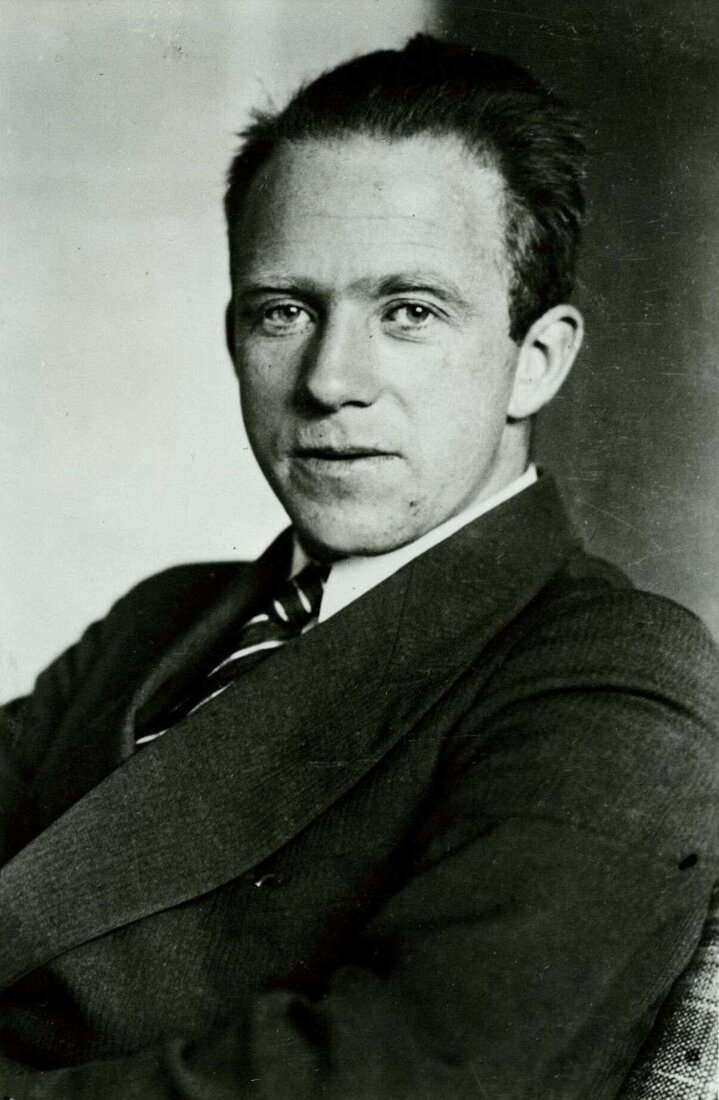
Werner HeisenbergBundesarchiv, Bild 183-R57262 · CC BY-SA 3.0 de
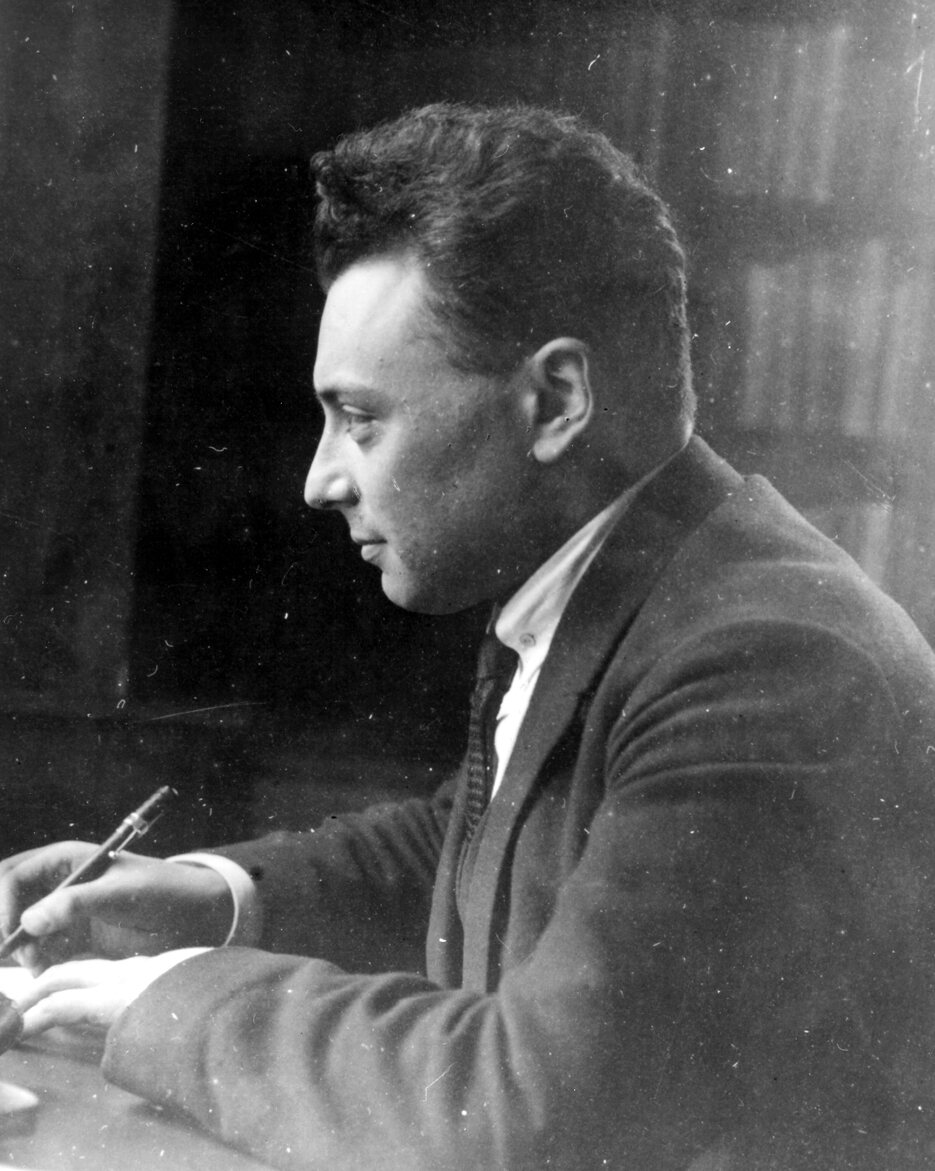
Werner Heisenberg1901 – 1976
Wolfgang Pauli
Wolfgang Pauli1900 – 1958

Uncertainty principle · 1927

Δp Δx ≥ ħ2

Confining a particle to a small region forces its momentum to be large.

Exclusion principle · 1925

Two identical fermions — electrons, protons, neutrons — cannot occupy the same quantum state.

Together: squeezing fermions costs energy, even at zero temperature.

Pauli exclusion principle

Why fermions push back

electrons in a box · two per levelsqueeze the box

Each energy level holds two electrons: one with spin up, the other spin down. The next ones are forced to go higher.

In a box of width Δx, the levels are spaced by Δp ≈ ħ/Δx. With N electrons, the last one has momentum N/2 · Δp: if Ne = 6, the maximum momentum is 3Δp.

Squeezing the box pushes the levels apart: the electrons gain momentum with no need for heat. That is degeneracy pressure.

Chandrasekhar · 1930 · Nobel Prize 1983

The maximum mass of white dwarfs
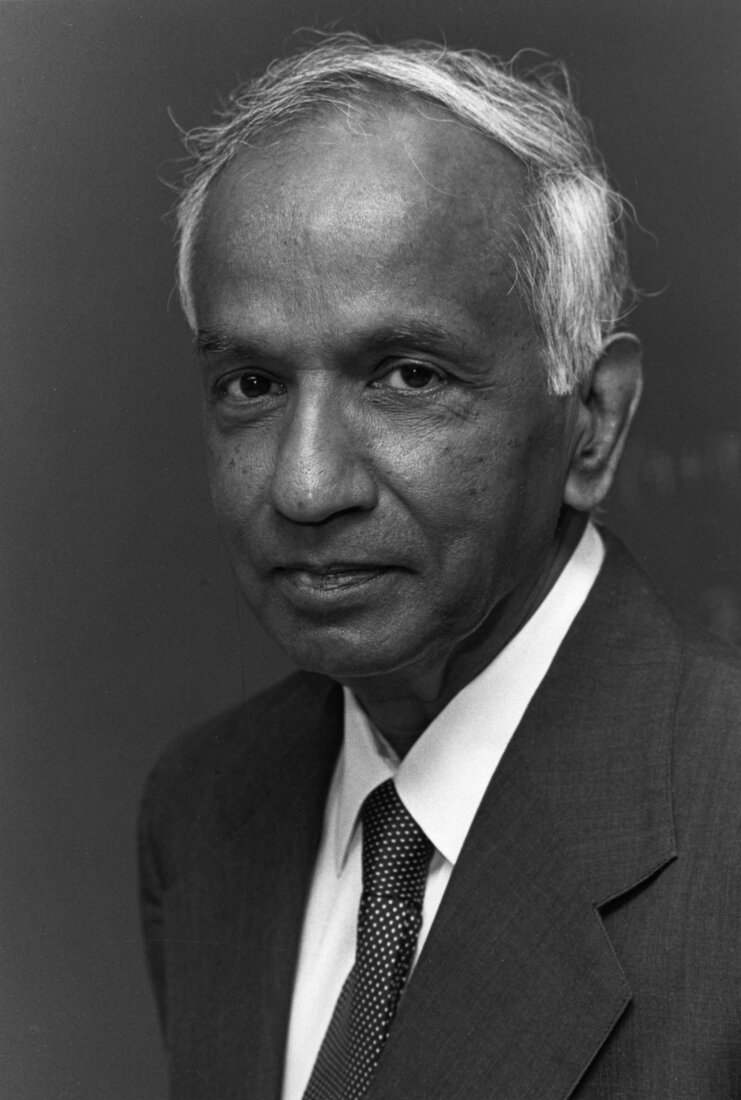
Subrahmanyan ChandrasekharAIP Emilio Segrè Visual Archives · attribution (AIP)
S. Chandrasekhar1910 – 1995
MCh = 3.10 (ħc/G)3/2(μe mH)² ≈ 1.44 M☉μe = 2 · carbon and oxygen
mass–radius relation of white dwarfsthe white dwarf gains mass from a companion

Curve: Nauenberg’s approximation (1972) for an electron gas at any degree of relativity. Points: Sirius B, Procyon B and 40 Eridani B. The more mass, the smaller the white dwarf — and at MCh the radius goes to zero.

M > MCh

Collapse! Next stop: neutron stars

At the end of a massive star’s life, the iron core passes 1.4 M☉ and the electrons can no longer hold it up. In less than a second it falls from ~3,000 km to ~30 km, the electrons are captured by the protons, turning them into neutrons — and the rest of the star is blown off in a supernova. A neutron star is left at the centre.

core collapsesupernovaremnantpulsar + nebula

Artist’s animation · NASA’s Goddard Space Flight Center Conceptual Image Lab (animation: Jonathan North) · SVS 20413 · public domain. A white dwarf that crosses the limit by accreting matter also explodes — a type Ia supernova — but leaves nothing behind.

IV

Part four

Neutron
stars

More than a solar mass in a 12 km sphere, spinning up to hundreds of times a second, with the strongest magnetic fields in the Universe.

pulsars · 1967magnetarslight that bendsnuclear densitySGR J1745−2900
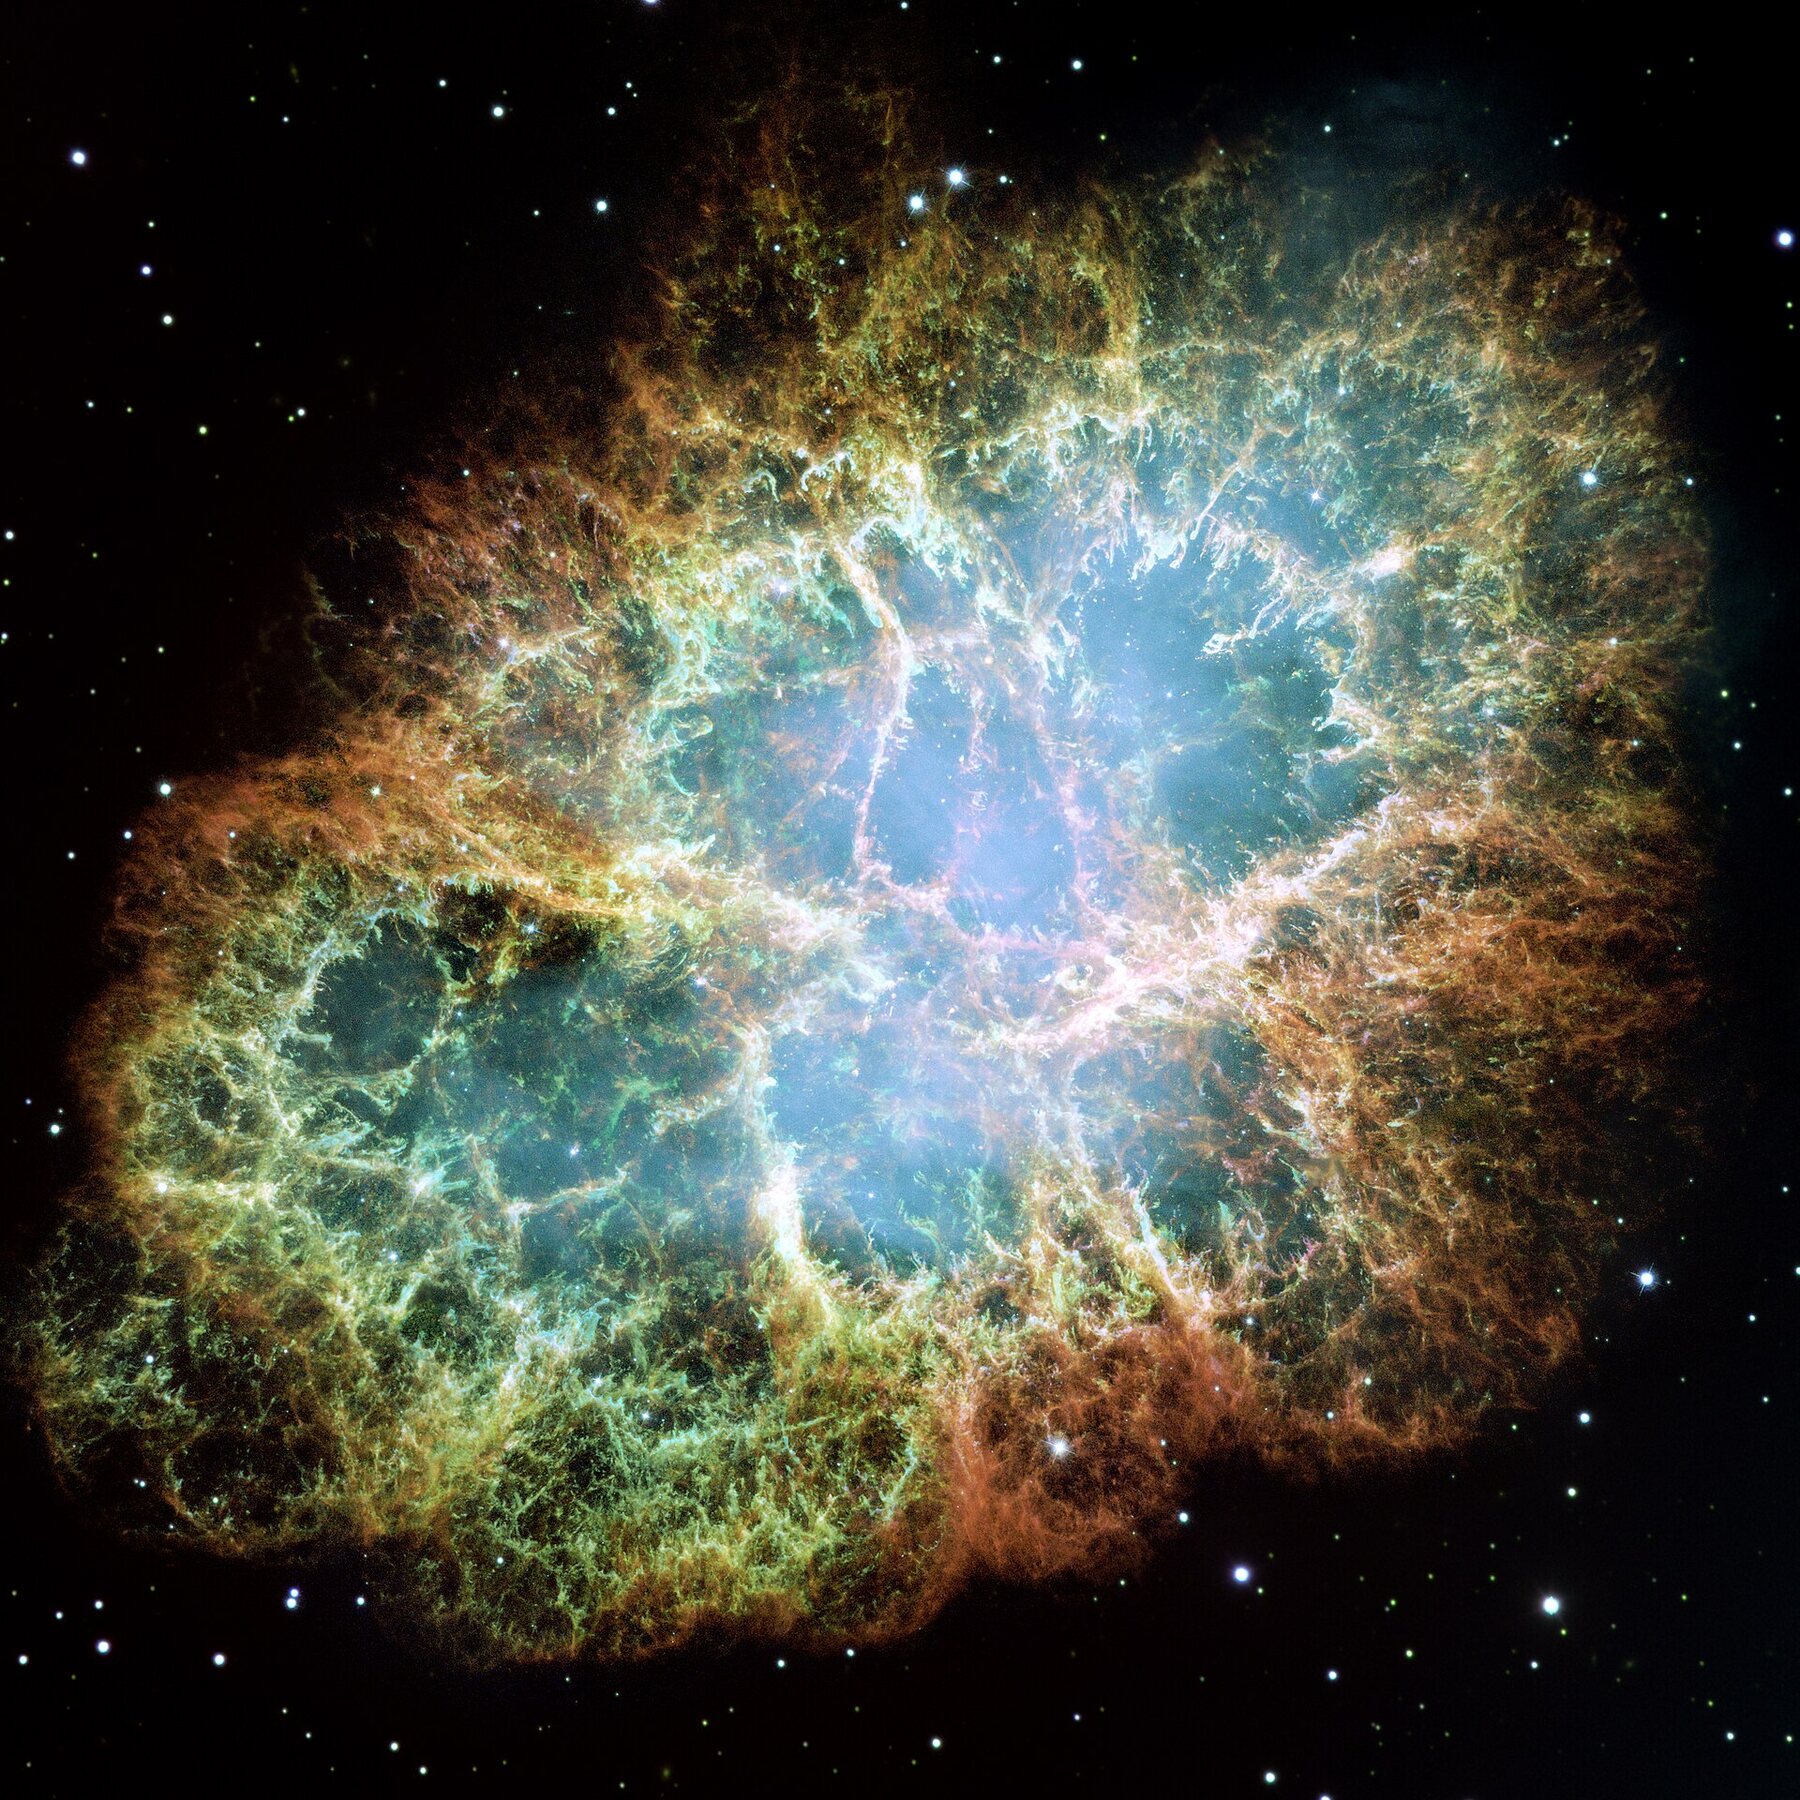
Crab Nebula · NASA, ESA, J. Hester and A. Loll · public domain

Supernova of 1054 · 6,500 light-years

The Crab Nebula

Crab NebulaNASA, ESA, J. Hester & A. Loll · public domain

1054

recorded by Chinese astronomers: visible in daylight for 23 days

33 ms

period of the pulsar at the centre: 30 turns a second

4×10³⁸ erg/s

lost by the rotation as it slows down — this is what lights up the whole nebula

Cambridge · 28 November 1967

The first pulsar: “LGM-1”

Jocelyn Bell BurnellRoger W Haworth · CC BY-SA 2.0
Jocelyn Bellin 1967, PhD student
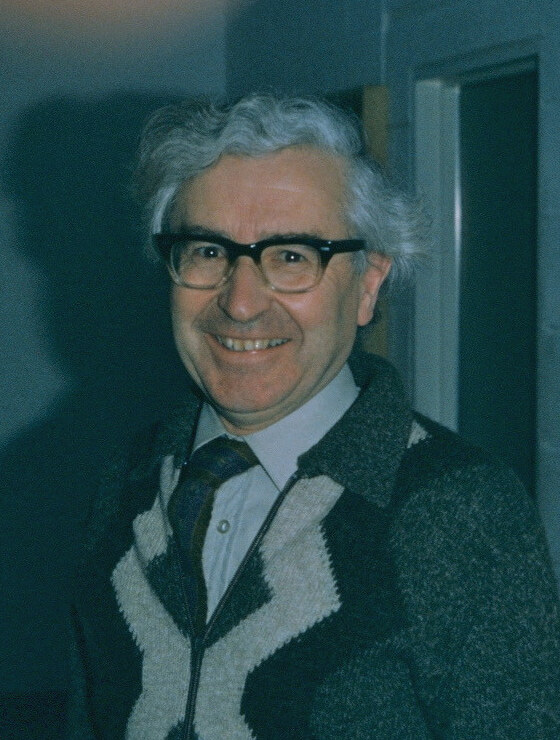
Antony HewishW. T. Sullivan III / NRAO/AUI · CC BY 4.0
Antony Hewishsupervisor · Nobel Prize 1974
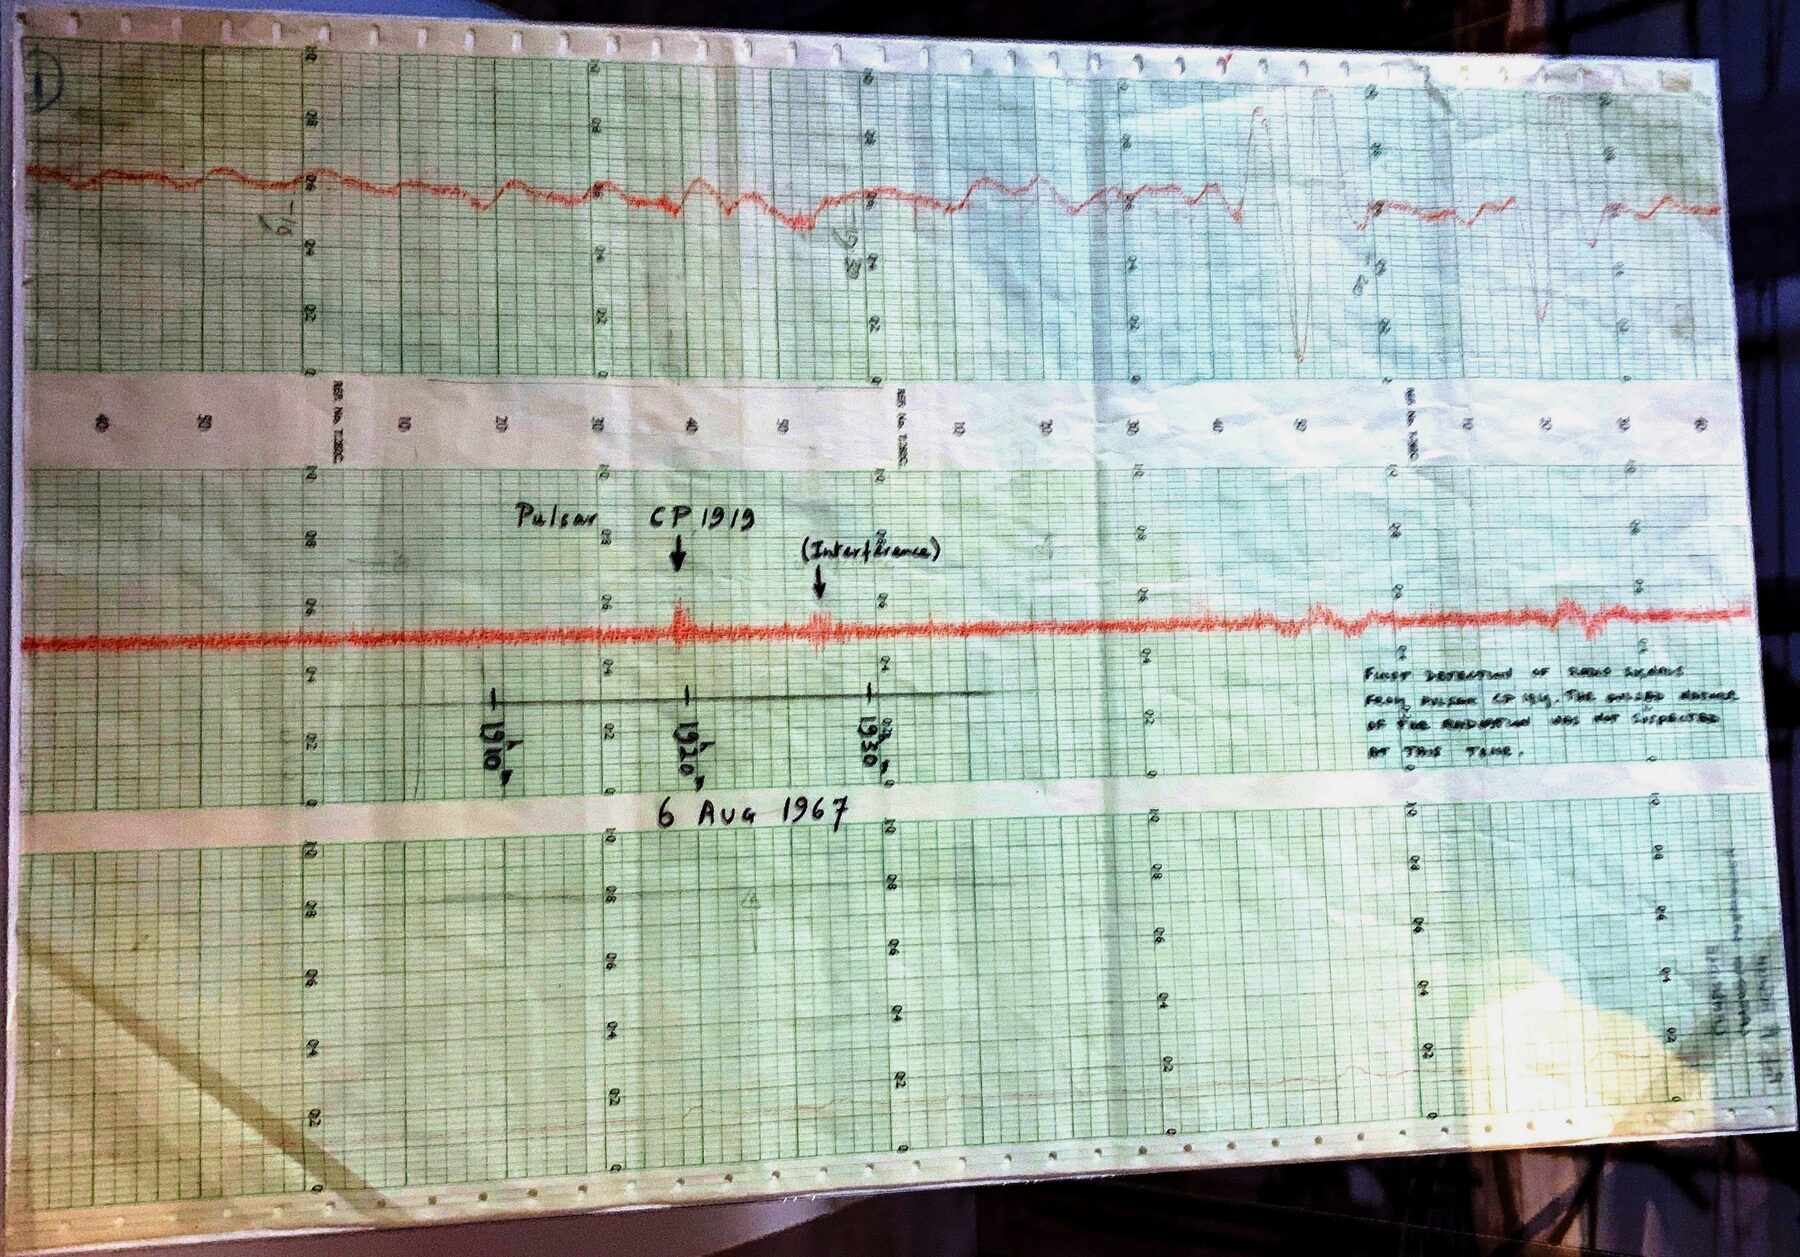
Paper chart of the first pulsar, 1967Bill Thompson · CC BY-SA 4.0
The original chart, August 1967: the “scruff” pencilled in as CP 1919.

Bell noticed a bit of “scruff” that kept coming back on the radio telescope’s paper chart: pulses every 1.337 s, as regular as clockwork. Nickname: LGM-1, for Little Green Men. It was a spinning neutron star.

Pulsar theory

What is measured, and what is inferred

ATNF catalogue · 2,855 pulsars with measured Ṗhover over the points
observableexpression
periodP
characteristic agetc = P/2Ṗ
magnetic fieldB = (3Ic³PṖ/8π²R⁶)1/2
rotational energy lostĖrot = −4π²IṖ/P³

Canonical neutron star

M = 1.4 M☉ · R = 10 km · I = 10⁴⁵ g cm²

B = 3.2×10¹⁹ (PṖ)1/2 G

|Ėrot| = 3.9×10⁴⁶ Ṗ/P³ erg/s

Only P and Ṗ are measured. The rest comes from assuming a spinning magnetic dipole — the straight lines in the diagram.

SGRs and AXPs

The magnetars

ordinary pulsarsSGRs / AXPs
P10⁻³ – 10 s2 – 12 s
Ṗ~10⁻¹⁵ s/s10⁻¹³ – 10⁻¹⁰ s/s
LX~10³⁰–10³³ erg/s10³² – 10³⁶ erg/s
tc> 10⁶ years~10³ – 10⁴ years

SGR: Soft Gamma Repeaters. AXP: Anomalous X-ray Pulsars. Two classes that turned out to be one: in the ATNF catalogue, 25 magnetars have a measured period.

  • Slow: P ≈ 2–12 s, for a canonical neutron star (1.4 M☉, 10 km, 10⁴⁵ g cm²).
  • Too bright in X-rays: LX > Ėrot. Rotation cannot pay the bill.
  • Who pays, in the standard model: giant magnetic fields, B > 10¹⁴ G — above the quantum critical field, 4.4×10¹³ G.

27 December 2004 · SGR 1806−20

A giant flare released ~10⁴⁶ erg in 0.2 s — more than the Sun emits in 100,000 years. At its peak, ~7×10⁴⁶ erg/s: some 20 trillion suns. It disturbed the Earth’s ionosphere from ~28,000 light-years away.

Transient activity

A magnetar, spinning

eventenergy
short bursts (~0.1 s)10³⁹ – 10⁴¹ erg
outbursts (months)10⁴¹ – 10⁴³ erg
giant flares10⁴⁴ – 10⁴⁶ erg

The field lines, anchored in the crust, get twisted over time. When the crust can no longer take the stress, it cracks — a starquake — and the magnetic energy comes out all at once.

Giant flares in the Galaxy and the Magellanic Clouds: 1979, 1998 and 2004.

A hot spot on the surface

Light bends: 85% of the surface in view

1.4 M☉, 10 km neutron star · R/Rs = 2.4

The highest density in the Universe

Forged in the core of a neutron star

“Thor Odinson, my heir, my firstborn. So long entrusted with the mighty hammer Mjölnir, forged in the heart of a dying star.”
Odin, in Thor (Marvel Studios, 2011)

And what if it were forged in the core of a neutron star, at ρ = 10¹⁴ g/cm³? A head of 17.5 × 26 × 18 cm:

M = ρV = 10¹⁴ gcm³ × 8,190 cm³ = 8.19×10¹⁷ g
Nelephants = 8.19×10¹⁷ g2.7×10⁶ g ≈ 300 billion

Research · modern equations of state

Mass and radius with real nuclear physics
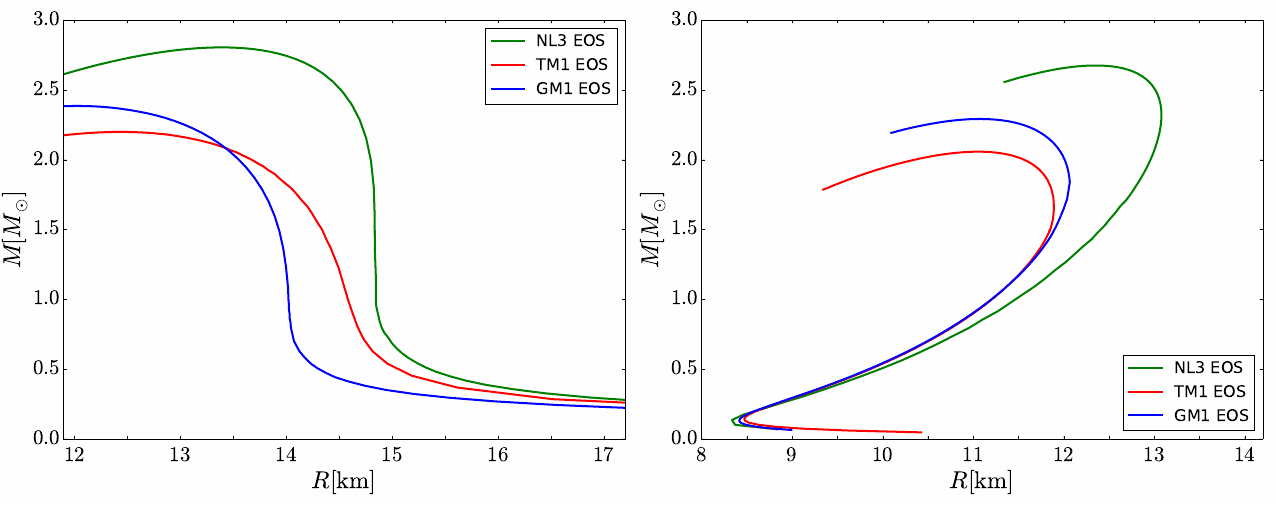
Mass–radius relation for the NL3, TM1 and GM1 equations of state
Mass–radius relation for the NL3, TM1 and GM1 equations of state, with local (left) and global (right) charge neutrality.

A neutron star is not a ball of free neutrons: the pressure comes from the nuclear force, described by relativistic mean-field models.

  • Each equation of state gives a curve M(R) — and a maximum mass, between ~2 and 2.8 M☉.
  • With these curves, M, R and the moment of inertia I are no longer canonical values: they are computed.

Figures in this section: R. C. R. de Lima and collaborators. Coelho, Cáceres, de Lima, Malheiro, Rueda & Ruffini, A&A 599, A87 (2017).

Research · who pays for the glow?

Magnetars powered by rotation?
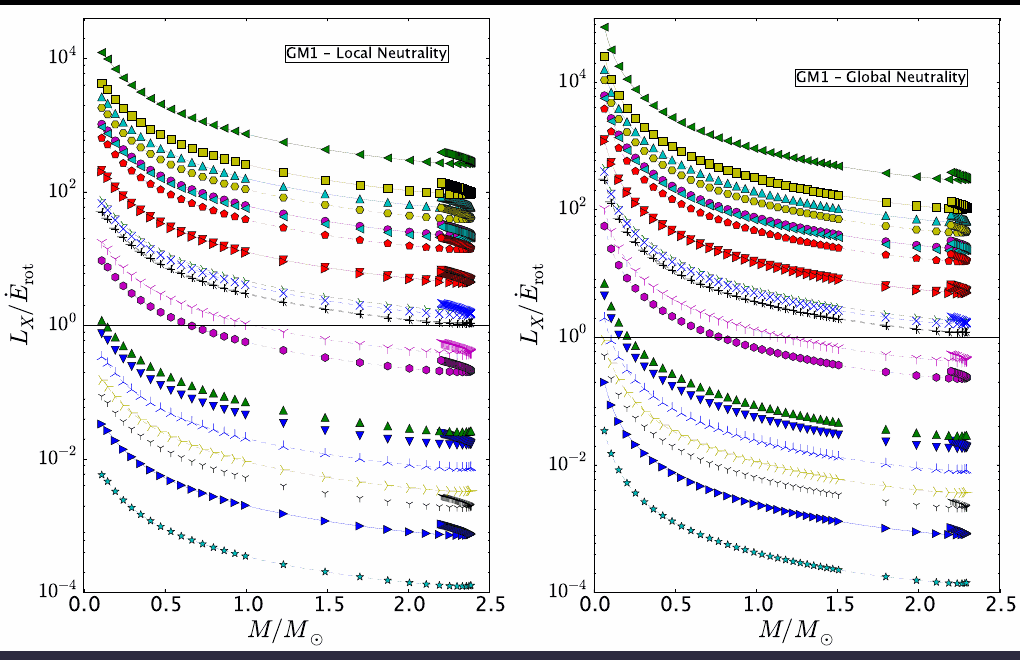
Ratio of X-ray luminosity to rotational energy loss, against mass
LX/Ėrot against mass, for the known SGRs and AXPs, with the GM1 equation of state (local and global neutrality).

With realistic I(M) and R(M), Ėrot changes. If LX/Ėrot < 1, rotation is enough: no giant field is needed.

Conclusion: 9 (+3?) rotation-powered

LX/Ėrot < 1: Swift J1834.9−0846, PSR J1846−0258, 1E 1547.0−5408, SGR J1745−2900, XTE J1810−197, PSR J1622−4950, SGR 1627−41, SGR 0501+4516, CXOU J171405.7−381031.

LX/Ėrot ~ 1: SGR 1900+14, SGR 0418+5729, Swift J1822.3−1606.

Discovered on 25 April 2013 · 0.1 pc from Sgr A*

SGR J1745−2900, the Galactic Centre magnetar

startpulsed fractionkTBB (keV)RBB (km)L (10³⁵ erg/s)
12 May 2013~0.380.88 ± 0.012.52 ± 0.094.9 ± 0.5
8–14 Oct 2016~0.550.64 ± 0.030.78 ± 0.110.13 ± 0.02

Chandra, 0.3–8 keV. Coti Zelati et al., MNRAS 471, 1819 (2017): three and a half years of the outburst’s decay.

PF = Fmax − FminFmax + Fmin

3.76 s

period

~5×10³⁵ erg/s

in the discovery outburst (Swift)

The hot spot shrank (from 2.5 to 0.8 km) and cooled, and the pulsed fraction rose. Can a real neutron star explain this?

Published version of this analysis: de Lima, Coelho, Pereira, Rodrigues & Rueda, ApJ 889, 165 (2020).

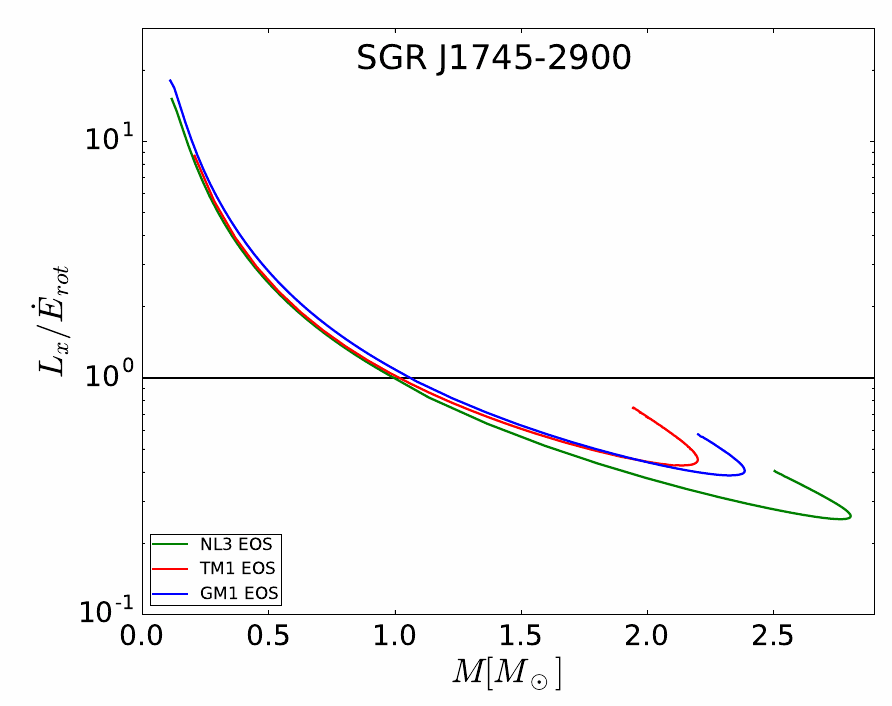
SGR J1745−2900

Two checks

Efficiency of SGR J1745-2900 against mass
1st · efficiency. LX/Ėrot < 1 for M > 1.0 M☉, in all three equations of state: rotation-powered.
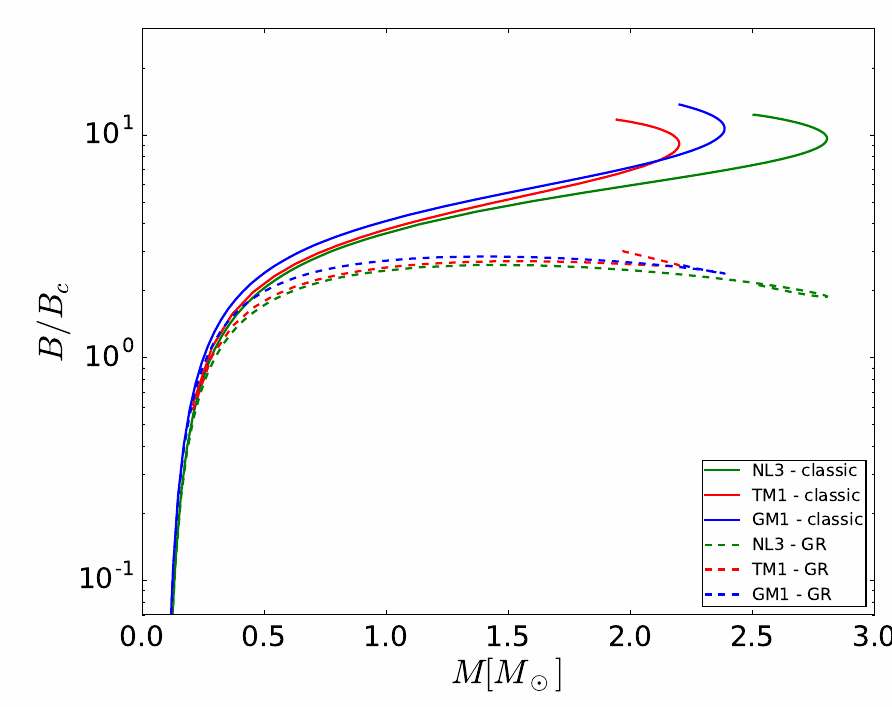
Magnetic field of SGR J1745-2900 against mass
2nd · magnetic field at the surface, in units of Bc = 4.41×10¹³ G: classical calculation (solid) and with General Relativity (dashed).

Turolla & Nobili 2013 · Beloborodov 2002

The pulsed-flux model

r̂ ĉ l̂ i j r̂ rotation axis · ĉ axis of the emitting cap · l̂ line of sight

i = arccos(r̂·ĉ)  ·  j = arccos(r̂·l̂)

  • Circular spots of any size, anywhere on the surface (Turolla & Nobili 2013).
  • M and R come from the equations of state (GM1, TM1, NL3).
  • Schwarzschild exterior: the rotation is slow (P ≈ 2–10 s) and its effects on the metric are neglected.
observer θ α photon path
1 − cos α = (1 − cos θ) (1 − Rs/R)Beloborodov’s approximation (2002)
Fν = (1 − Rs/R)² Bν(T) Aeff,   Aeff = R² [ RsR Is + (1 − RsR) Ip ]flux from a black-body spot · effective area

Research · the code

What the code computes

Main output

  • map of pulsed fractions in the (i, j) plane;
  • light curve: normalised flux against rotational phase.

Side calculations

  • angular opening of the polar cap (light cylinder);
  • Beloborodov angle and visible area of the star;
  • maximum possible pulsed fraction.

Validity

Error < 3% for R > 3Rs (here, R/Rs = 3.38), with Rs = 2GM/c².

variabledefinitionsource
M, Rmass and radiusequation of state
Ns, θc, Tnumber, half-opening and temperature of the spotsblack-body fit
θdangular distance between the spotspulsed fraction
i, jviewing anglesPF and pulse profile

Beloborodov classes (2002)

I · the antipodal spot never appears, and the primary is seen all the time. II · the primary always, and the antipodal for part of the time. III · the primary disappears for a fraction of the period. IV · both are seen all the time.

SGR J1745−2900 · 2016

Pulsed fraction and light profile
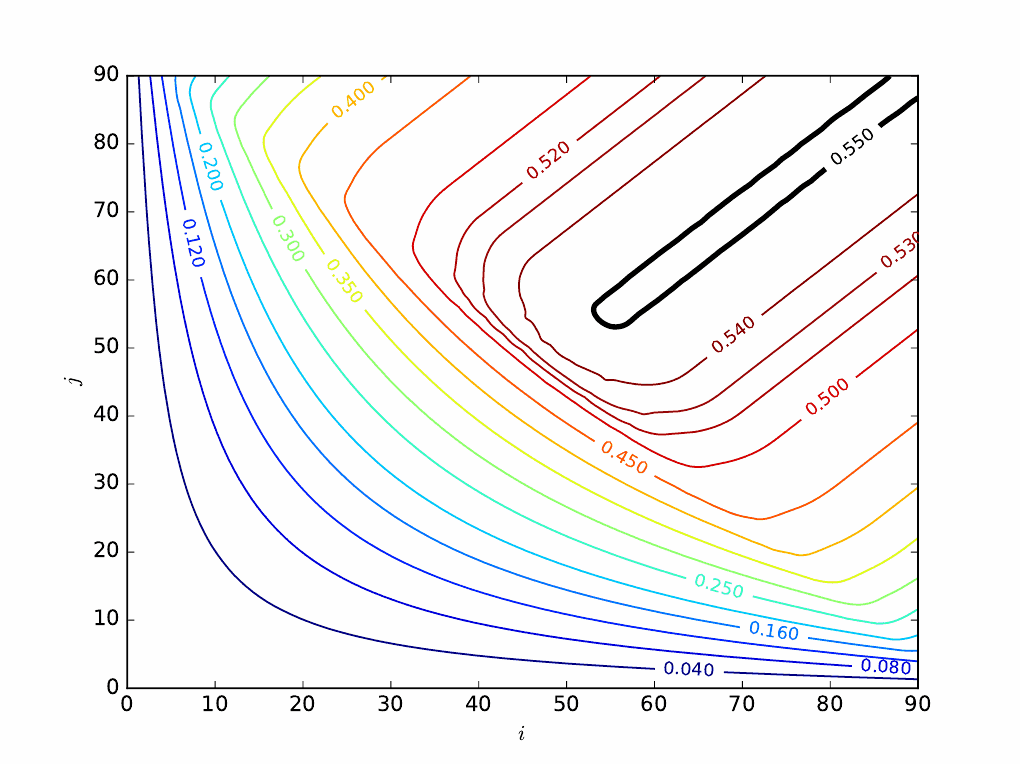
Map of the pulsed fraction in the i, j plane
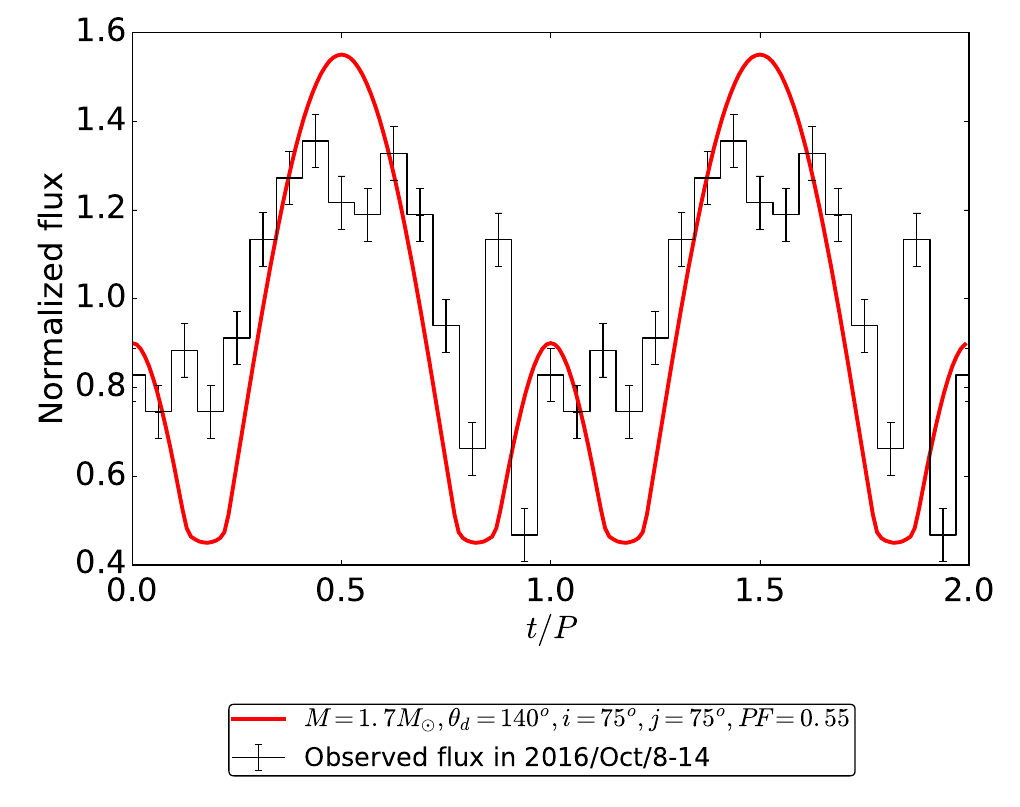
PF map in the (i, j) plane. The thick black curve is PF = 0.55, the value observed in 2016.
Modelled light profile against the one observed in 2016
Pulse profile: the model (red) with M = 1.7 M☉, θd = 140°, i = j = 75°, against the flux observed by Chandra on 8–14 October 2016.

V

Part five

Black
holes

When not even the neutrons can hold, the star falls inside its own horizon — and vanishes from the visible Universe.

maximum massLaplace · 1796Schwarzschild · 1916the horizonSgr A*
The centre of the Milky Way · ESO · CC BY 4.0

Tolman · Oppenheimer · Volkoff · 1939

Mmax ≈ 2 M☉ — and beyond?
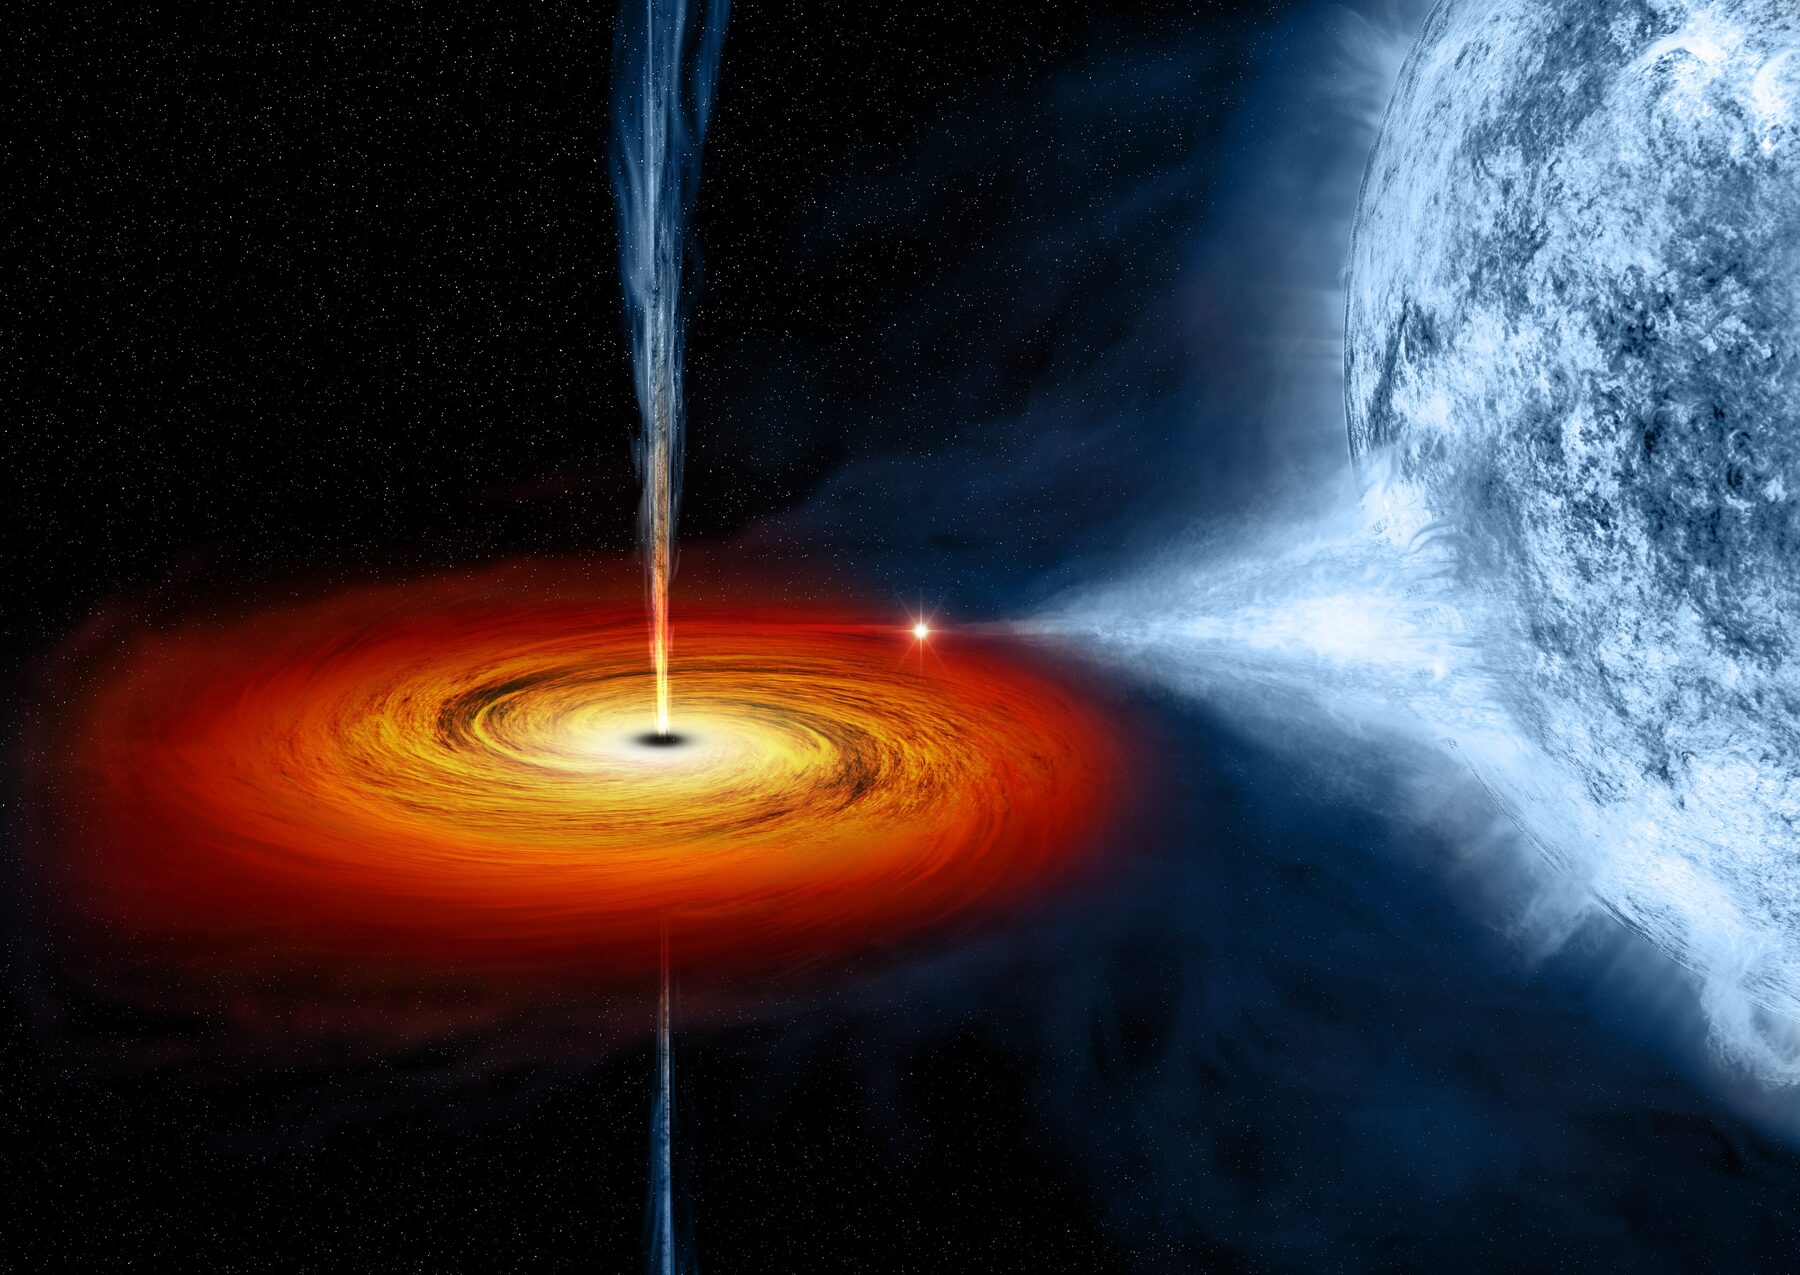
Illustration of a black hole stealing gas from a companion starNASA/CXC/M. Weiss · public domain

Neutron stars also have a maximum mass. Above ~2–2.3 M☉, neither neutron pressure nor the nuclear force can hold the star up.

2.08 M☉

PSR J0740+6620, the heaviest measured precisely

~21 M☉

Cygnus X-1, the first accepted black hole (1972)

But what if the neutron star gains more mass — accreting gas from a companion — and goes over Mmax?

The final collapse

Nothing can stop the collapse

No known force can hold the star up.

And what if there is some physics we don’t know yet, strong enough to halt the collapse?

It makes no difference: once the event horizon forms, it is too late. Inside, every future points to the centre.

1783 – 2019

A brief history of black holes

1783

Michell: “dark stars”, from which light cannot escape

1796

Laplace arrives at the same idea

1916

Schwarzschild: the first exact solution of GR

1935

Eddington: “there should be a law of Nature…”

1939

Oppenheimer & Snyder: the collapse, calculated

1963

Kerr: black holes that spin

1967

Wheeler popularises the name “black hole”

2019

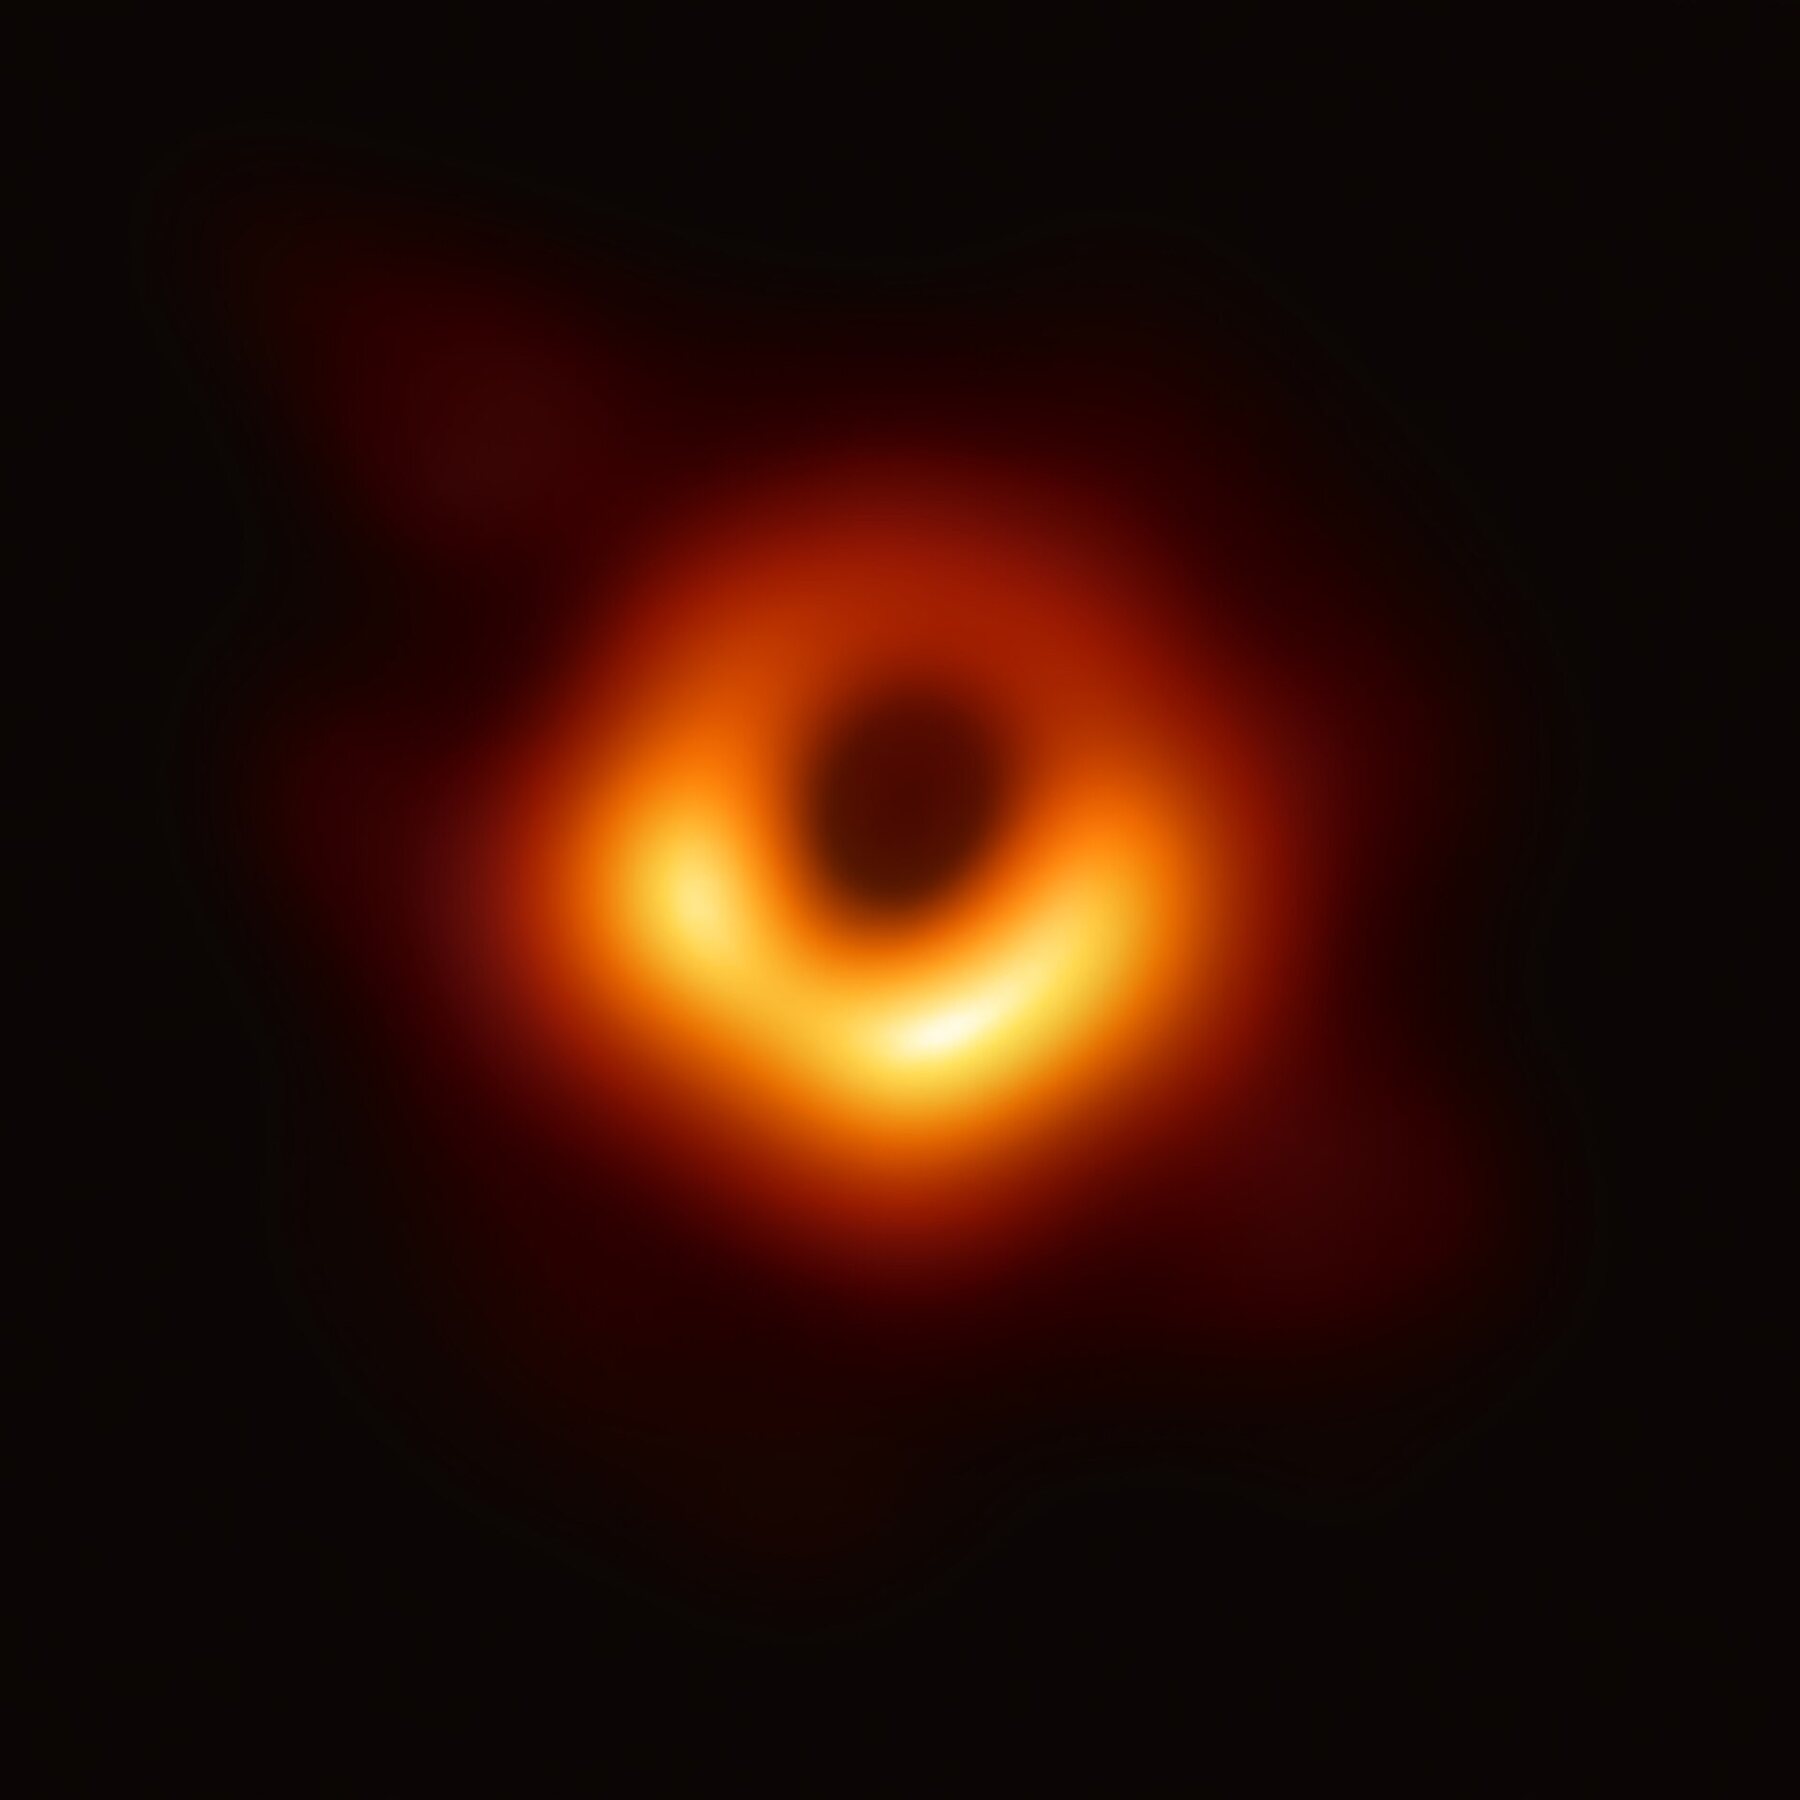
EHT: the first image, of M87*

1796 · Pierre-Simon Laplace

A dark star
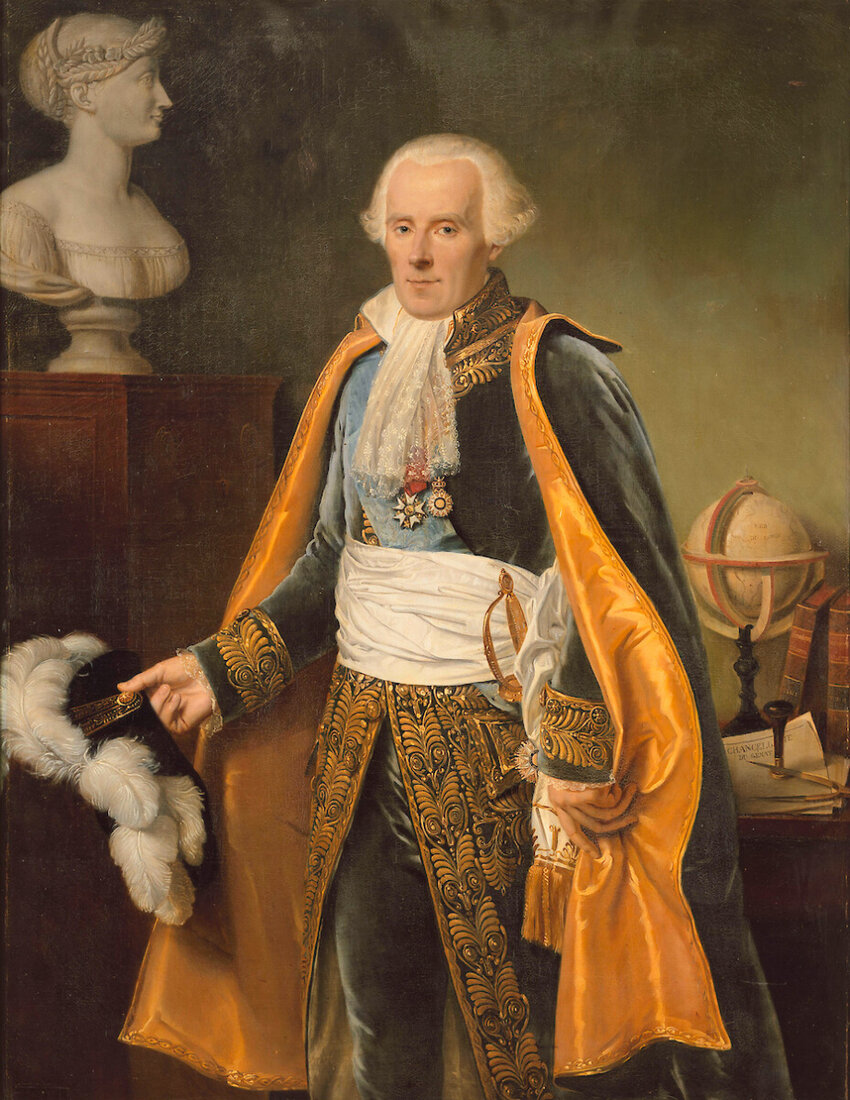
Pierre-Simon LaplaceJean-Baptiste Paulin Guérin · public domain
Pierre-Simon Laplace1749 – 1827

By Newton’s physics, light could not escape from a sufficiently massive and compact object.

mv²2 − GMmR = 0  ⇒  vesc = 2GMR1/2initial energy = final energy

On Earth, vesc = 11.18 km/s. At what r would the escape velocity equal the speed of light?

r = 2GMc²

Earth: 8.9 mm. Sun: 2.95 km.

squeeze the Earthfixed mass

December 1915 · the Russian front

A month after Einstein
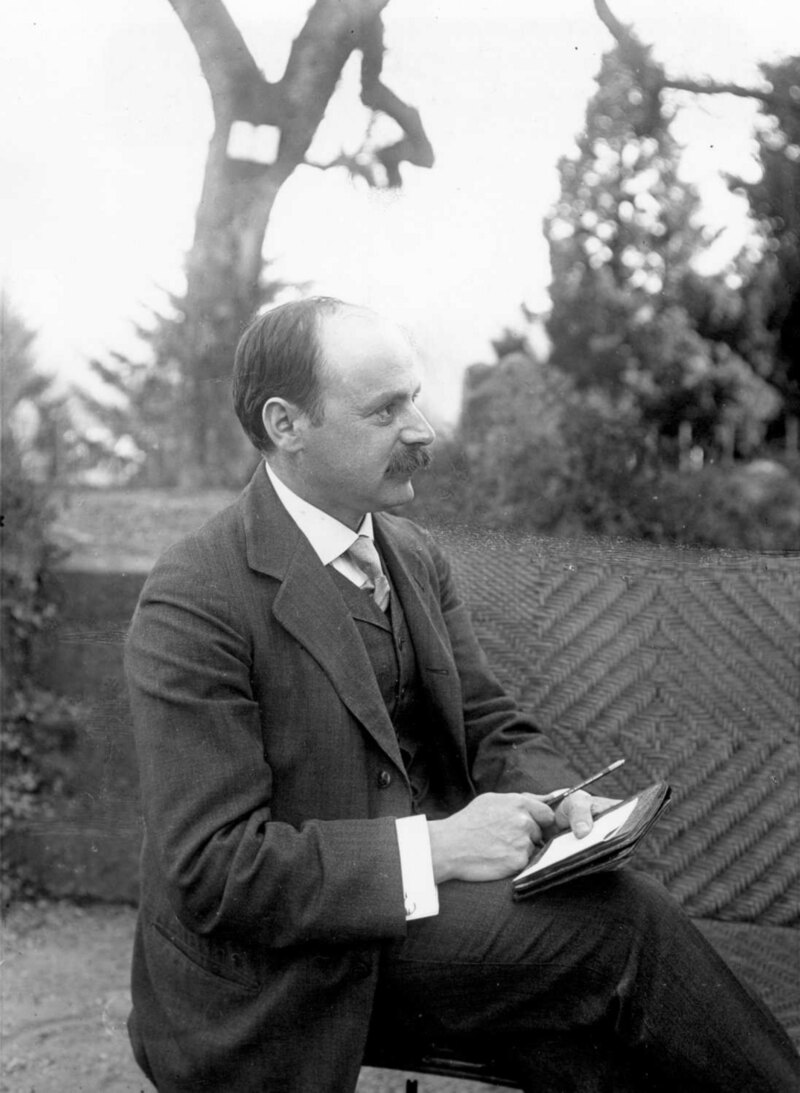
Karl Schwarzschild
Karl Schwarzschild1873 – 1916
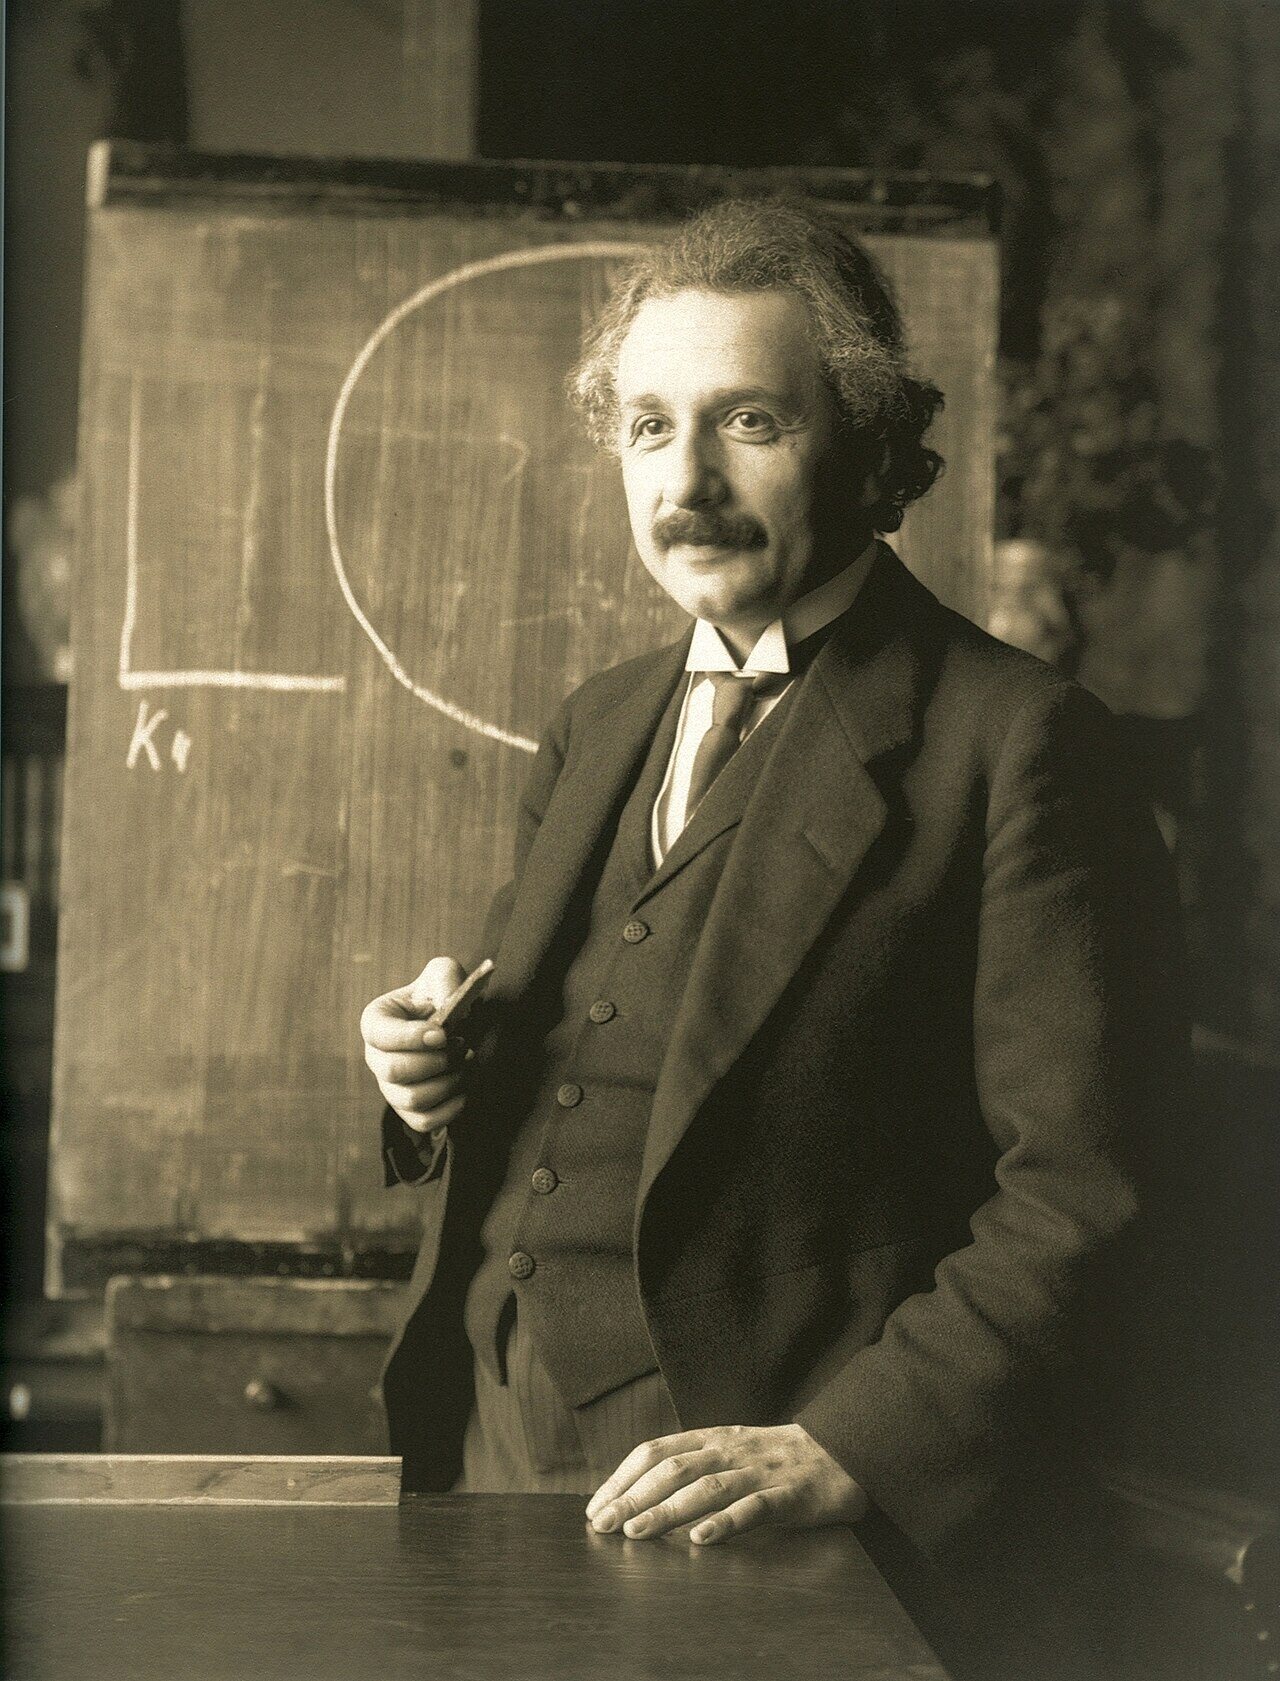
Albert EinsteinF. Schmutzer · public domain
Albert Einstein1921

Barely a month after Einstein presented General Relativity (25 November 1915), Schwarzschild — serving in the artillery on the Russian front — found an exact analytical solution of the equations.

“I have read your paper with the utmost interest. I had not expected that one could formulate the exact solution of the problem in such a simple way. I liked very much your mathematical treatment of the subject.”
Einstein to Schwarzschild, 9 January 1916

Schwarzschild died in May 1916, of an illness he contracted at the front.

Spherical, uncharged, non-rotating

The first exact solution was already a black hole

What neither of them knew

The solution was complete: besides the exterior of a star, it described a spherical, neutral, non-rotating black hole — the Schwarzschild black hole.

Until then

Einstein had only looked for approximate solutions — the post-Newtonian formalism — and used them to explain the bending of light by the Sun and the precession of Mercury.

It took some 50 years for the community to accept that such a thing really existed.

The shadow of M87*EHT Collaboration · CC BY 4.0
The shadow of M87*, Event Horizon Telescope, 2019 — 103 years later.

Royal Astronomical Society · 11 January 1935

Eddington versus Chandrasekhar
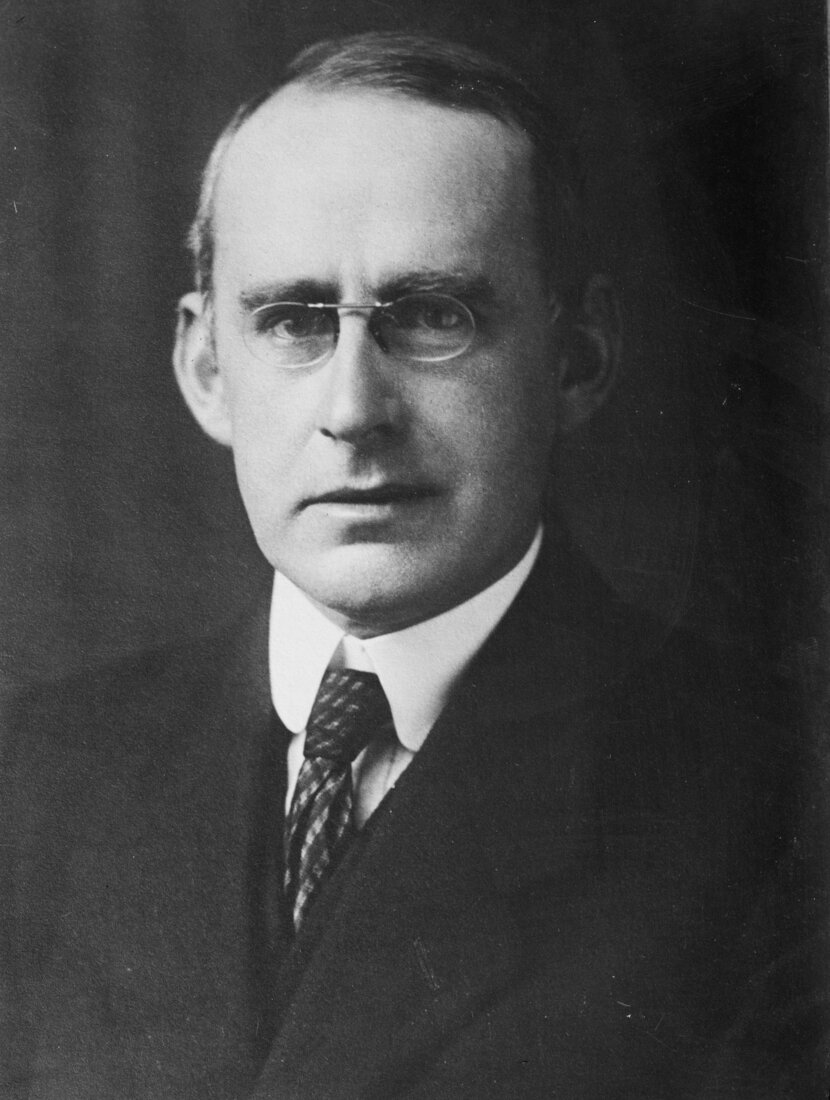
Arthur EddingtonBain News Service · public domain
Arthur Eddington1882 – 1944

One of the first to understand General Relativity, Eddington saw it at once: if Chandrasekhar was right about the mass limit, massive stars would inevitably form black holes.

“I think there should be a law of Nature to prevent a star from behaving in this absurd way!”
Arthur Eddington, Royal Astronomical Society, 11 January 1935

Chandrasekhar would later regret that it took almost thirty years for the significance of his result to be recognised.

K. C. Wali, Chandra: a biography of S. Chandrasekhar (1991).

Subrahmanyan Chandrasekhar
Chandrasekharaged 24 in 1935

1939 · 1963 · 1967

The collapse, the spin and the name
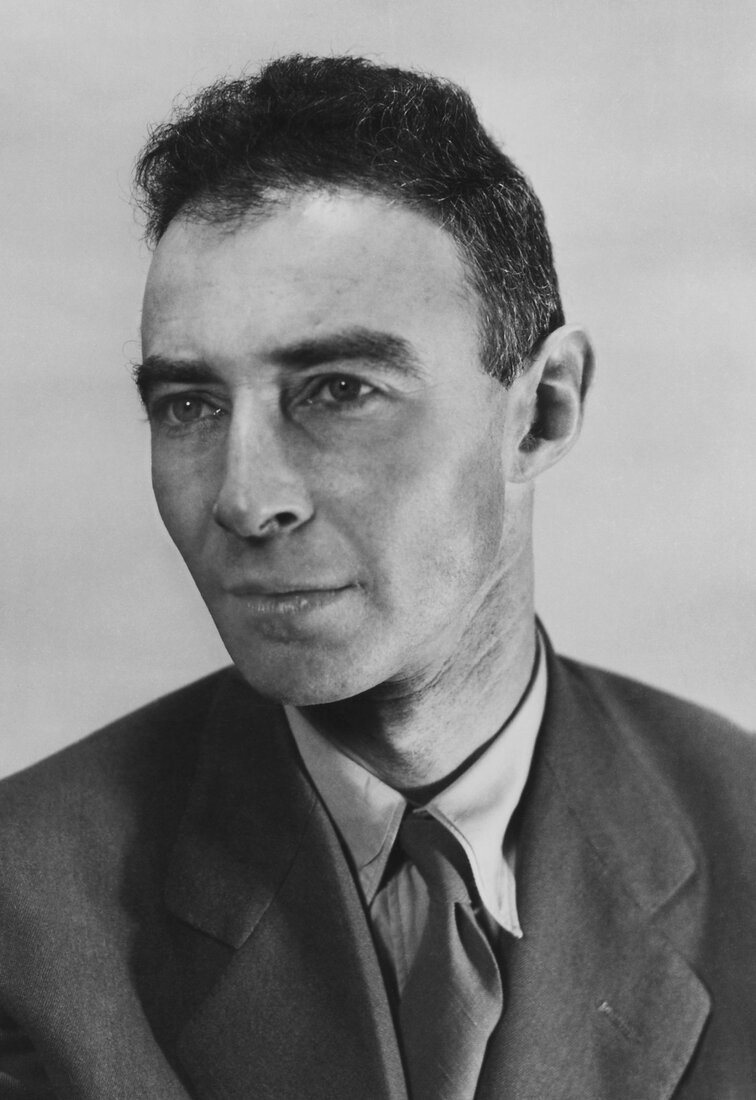
J. Robert OppenheimerU.S. Department of Energy · public domain

1939 · OppenheimerWith Snyder, the first rigorous calculation of a star collapsing all the way to a black hole. With Volkoff, the maximum mass of neutron stars.
Roy KerrBengt Nyman · CC BY-SA 4.0
1963 · Roy KerrAnother exact solution of Einstein’s equations: a spinning black hole. It is what nature should produce.
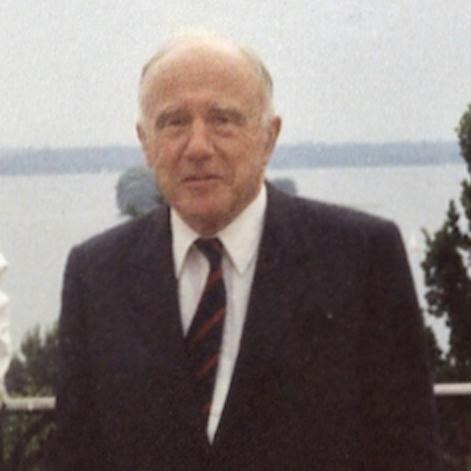
John Archibald WheelerEmielke · CC BY-SA 3.0
1967 · John A. WheelerPopularises the term “black hole” — to the dismay of the French, for whom trou noir sounded indecent.

The Schwarzschild metric

Three slices of the same formula

Δs² = −(1 − 2GMc²r)(cΔt)² + (1 − 2GMc²r)−1(Δr)² + r²[(Δθ)² + sin²θ (Δφ)²]M = mass of the central object

Δt = Δθ = Δφ = 0

Δrp = (1 − 2GM/c²r)−1/2 Δr

Radial distances measured with a ruler: larger than Δr.

Δr = Δθ = Δφ = 0

Δτ = (1 − 2GM/c²r)1/2 Δt

The time on a clock at rest: it runs slower than one far away.

Δt = Δr = 0

ΔS = r [(Δθ)² + sin²θ (Δφ)²]1/2

The angular part is the familiar one: the distance between two points on the Earth’s surface (θ = 90° − latitude).

Proper distance

The ruler in the well

  • r is the coordinate of an observer at infinity: the circumference divided by 2π.
  • Δrp is the distance a local observer measures with a ruler.
  • Distances are larger than they would be in flat space: between the spheres of circumference 2πr₁ and 2πr₂ there is more than r₂ − r₁.
  • The factor (1 − rs/r)−1/2 diverges at rs, but the distance to the horizon is finite: from 3rs down to rs it is 3.6 rs, not 2.

On the left, Flamm’s paraboloid: the equatorial slice (constant t) drawn as a surface with the same geometry.

The event horizon

The Schwarzschild radius

RS = 2GMc²2.95 km per solar mass

Where the factor (1 − 2GM/c²r) in the metric vanishes. There is nothing there — no surface, no wall: it is a causal boundary. What goes in does not come out.

objectmassRS
Earth6×10²⁴ kg8.9 mm
Sun1 M☉2.95 km
neutron star (radius 12 km)1.4 M☉4.1 km
Cygnus X-121 M☉62 km
Sgr A*4.3×10⁶ M☉12.7 million km · 18 R☉
M87*6.5×10⁹ M☉1.9×10¹⁰ km · 128 AU

Proper time

Time in the well

two identical clocks · one far away, one in the welllower the clock
Δτ = (1 − 2GMc²r)1/2 Δt
  • The clock deep in the well runs slower, as seen from far away — and it is no illusion: when it comes back up, it shows less time.
  • GPS: +45 μs/day from altitude, −7 μs/day from the satellites’ speed. Without the correction, an error of ~10 km a day.
  • At the surface of a neutron star: Δτ/Δt ≈ 0.8 — some 12 minutes lost every hour.
  • At the horizon, Δτ/Δt → 0.

What happens at the horizon?

Seen from afar, time freezes

a probe falls in and blinks every second of its own clockradial fall, Schwarzschild

An observer at infinity would see time freeze at RS. Does that mean light stops?

No! It means it is trapped. For photons Δs² = 0; if Δτ → 0, the spatial terms vanish too (Δr = Δθ = Δφ = 0): the photon does not leave that region.

Photons: our natural clocks

A wave of frequency f is a clock that ticks 1/Δt times per second:

f∞ = (1 − 2GM/c²r)1/2 flocal

Whoever falls in notices nothing special when crossing the horizon.

Beyond the horizon

Every future points to the centre

Matter must move inside the light cones.

  • Far away, the cone is the familiar one: you can go outwards or inwards.
  • Near the horizon, it tips inwards, but still leaves a way out.
  • At the horizon, the outer edge becomes vertical: “outgoing” light stands still.
  • Inside, both sides of the cone point to smaller r: moving towards the future means moving towards the centre.

Eddington–Finkelstein coordinates: t̃ = t + rs ln|r/rs − 1|; infalling light follows straight lines at 45°.

The centre of the Milky Way · 27,000 light-years

Sagittarius A*: stars orbiting nothing

measured orbits of the S stars · position on the sky1 year ≈ 0.6 s

4.3×10⁶ M☉

mass at the centre

16 years

period of S2

S2 passes ~120 AU from the centre at ~7,700 km/s, 2.6% of c. In 2018 and 2020 the VLT measured its gravitational redshift and its Schwarzschild precession.

Reinhard GenzelESO/Mahdi Zamani · CC BY-SA 4.0
Reinhard GenzelVLT · since 1992
Andrea GhezBorderlineRebel · CC BY-SA 4.0
Andrea GhezKeck · since 1995

Nobel Prize 2020, with Roger Penrose. Orbits: Gillessen et al., ApJ 837, 30 (2017).

Event Horizon Telescope · 2019 and 2022

The shadows

M87*M87* · 2019 · 6.5 billion M☉ · 55 million light-yearsEHT Collaboration · CC BY 4.0
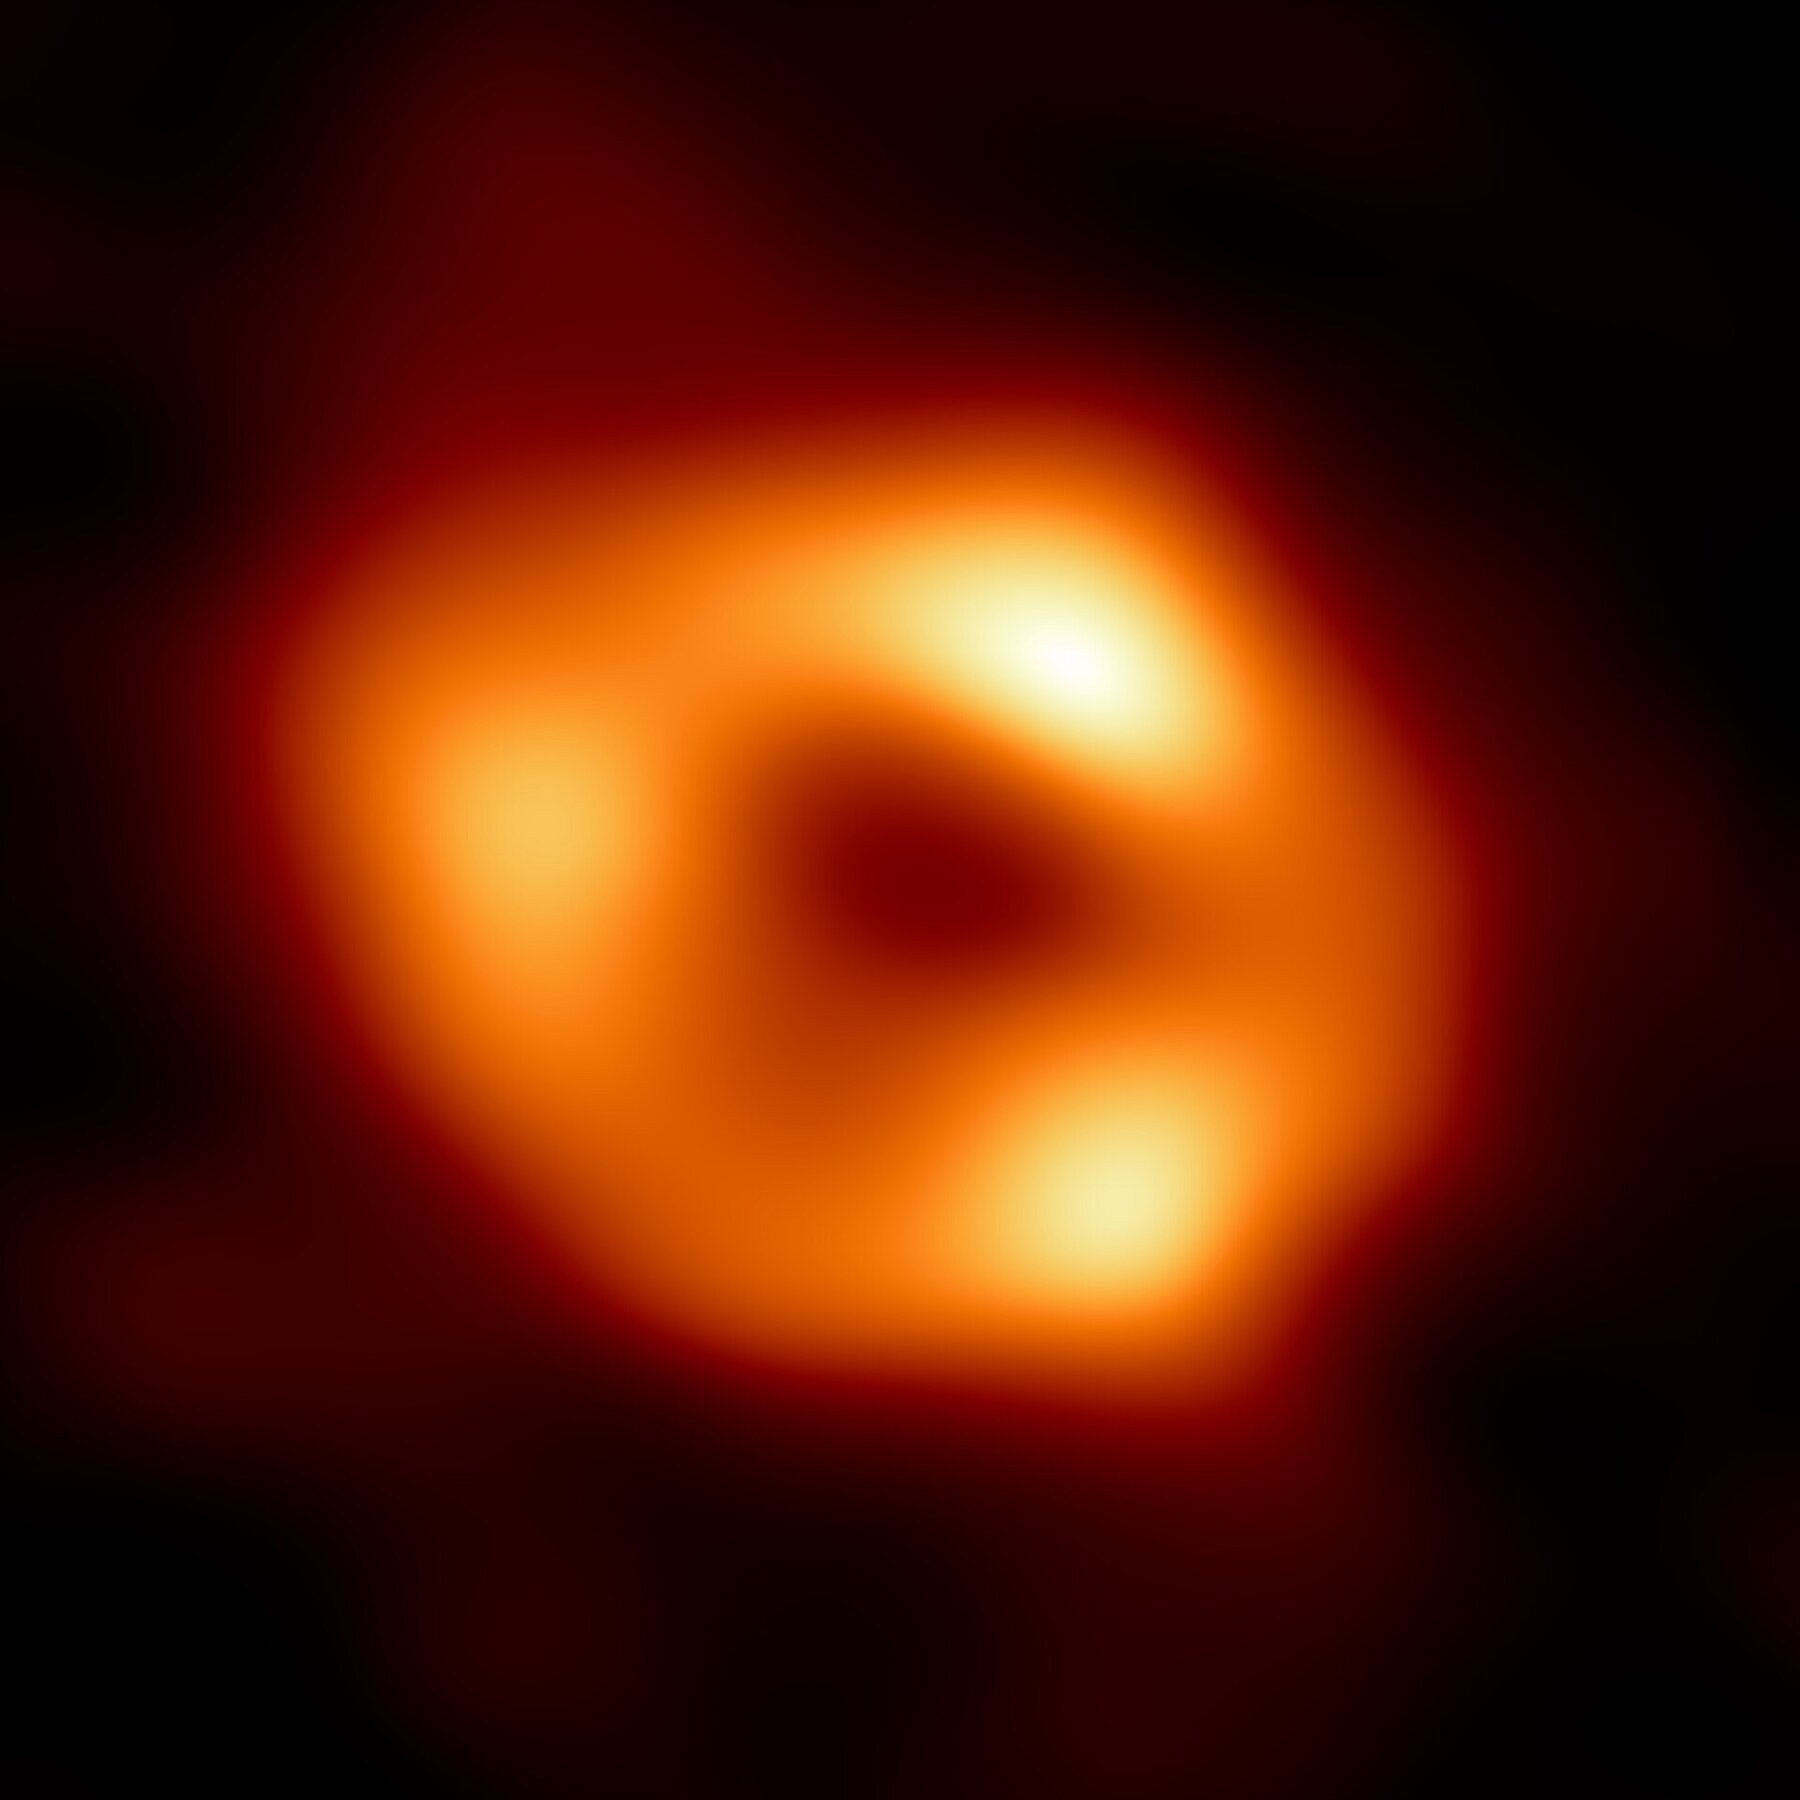
Sgr A*Sgr A* · 2022 · 4.3 million M☉ · 27,000 light-yearsEHT Collaboration · CC BY 4.0

The ring is ~5 RS across: it is the photon sphere, at 1.5 RS, seen through the lens of the black hole itself — shadow diameter = 2√27 GM/c² ≈ 5.2 RS.

Schwarzschild geodesics

How light bends

u″ + u = 32 RS u²u = 1/r · orbit equation for light
  • b > 3√3 GM/c² ≈ 2.6 RS: the light is deflected and escapes.
  • b = 2.6 RS: unstable orbit on the photon sphere, r = 1.5 RS.
  • b < 2.6 RS: captured.

The term on the right is the General Relativity correction. Without it, light would travel in a straight line.

Kerr geodesics · 1963

The black hole that spins

light rays in the equatorial planedrag the spin
  • The rotation drags the spacetime around it (the Lense–Thirring effect).
  • Light travelling with the rotation gets closer before being captured: the photon orbit goes from 1.5 RS down to 0.5 RS as a → M.
  • Against the rotation, the orbit moves out, up to 2 RS.
  • Capture becomes asymmetric: the shadow shifts and flattens on one side.

Kerr null geodesics in Boyer–Lindquist coordinates, integrated in Mino time.

r = 0

The singularity

Δs² = −(1 − 2GMc²r)(cΔt)² + (1 − 2GMc²r)−1(Δr)² + r²[(Δθ)² + sin²θ (Δφ)²]   r = 0 → singularity

r = RS is not singular

The metric seems to blow up there, but that is just a bad choice of coordinates — like longitude at the North Pole. Whoever falls in crosses the horizon without noticing, and the curvature there is finite.

r = 0 is

The curvature diverges — the Kretschmann invariant goes as 48G²M²/c⁴r⁶ — and tidal forces stretch anything apart. General Relativity predicts its own limit: a quantum theory of gravity has to take over there, and we do not have one yet.

Recap

Three masses decide the end

MJ

Jeans

Above it, a cold cloud collapses, fragments and lights up stars. It shrinks as the cloud gets denser.

1.44 M☉

Chandrasekhar

Above it, degenerate electrons cannot hold: there is no white dwarf, and the iron core collapses.

~2.2 M☉

Tolman–Oppenheimer–Volkoff

Above it, not even neutrons can hold: a horizon forms, and the star becomes a black hole.

The whole life of a star is gravity on one side and, on the other, heat, fusion and — in the end — quantum mechanics.

Image credits

Freely licensed photos and figures

Albert Einstein — Ferdinand Schmutzer / Adam Cuerden · public domain

Karl Schwarzschild — unknown author · public domain

M87* (EHT) — Event Horizon Telescope Collaboration · CC BY 4.0

Sgr A* (EHT) — EHT Collaboration · CC BY 4.0

Crab Nebula — NASA, ESA, J. Hester and A. Loll (Arizona State University) · public domain

The Sun (SDO) — NASA/SDO (AIA) · public domain

Hertzsprung–Russell diagram — ESO · CC BY 4.0

Wolfgang Pauli — unknown author · CC BY 4.0

Supernova animation (video) — NASA's Goddard Space Flight Center Conceptual Image Lab (Jonathan North) · public domain

Pillars of Creation, Webb 2022 — NASA, ESA, CSA, STScI; image processing: Joseph DePasquale, Anton M. Koekemoer, Alyssa… · public domain

Pillars of Creation, Hubble 2014 — NASA, ESA, Hubble Heritage Team (STScI/AURA) · public domain

“Cosmic Cliffs”, Carina Nebula — NASA, ESA, CSA, STScI · public domain

Orion Nebula — NASA, ESA, M. Robberto (Space Telescope Science Institute/ESA) and the Hubble Space… · public domain

HL Tauri disc — ALMA (ESO/NAOJ/NRAO) · CC BY 4.0

Ivy Mike, 1952 — National Nuclear Security Administration / Nevada Site Office · public domain

Betelgeuse — ESO/M. Montargès et al. · CC BY 4.0

Ring Nebula (M57) — ESA/Webb, NASA, CSA, M. Barlow, N. Cox, R. Wesson · CC BY 4.0

Werner Heisenberg — Bundesarchiv, Bild 183-R57262 / unknown author · CC BY-SA 3.0 de

Subrahmanyan Chandrasekhar — AIP Emilio Segrè Visual Archives, Gift of Kameshwar Wali · attribution (AIP)

Jocelyn Bell, 1967 — Roger W Haworth · CC BY-SA 2.0

Antony Hewish — Woodruff T. Sullivan III / NRAO/AUI Archives (NRAO/AUI/NSF) · CC BY 4.0

Pierre-Simon Laplace — Jean-Baptiste Paulin Guérin · public domain

Arthur Eddington — Bain News Service (Library of Congress) · public domain

J. Robert Oppenheimer — unknown author (U.S. Department of Energy) · public domain

John A. Wheeler — Emielke · CC BY-SA 3.0

Roy Kerr — Bengt Nyman · CC BY-SA 4.0

Cygnus X-1 (illustration) — NASA/CXC/M. Weiss · public domain

The centre of the Milky Way — ESO · CC BY 4.0

Andrea Ghez — BorderlineRebel · CC BY-SA 4.0

Reinhard Genzel — ESO/Mahdi Zamani · CC BY-SA 4.0

Neutron star over Manhattan — NASA's Goddard Space Flight Center · public domain

Chart record of CP 1919, 1967 — Bill Thompson (Billthom) · CC BY-SA 4.0

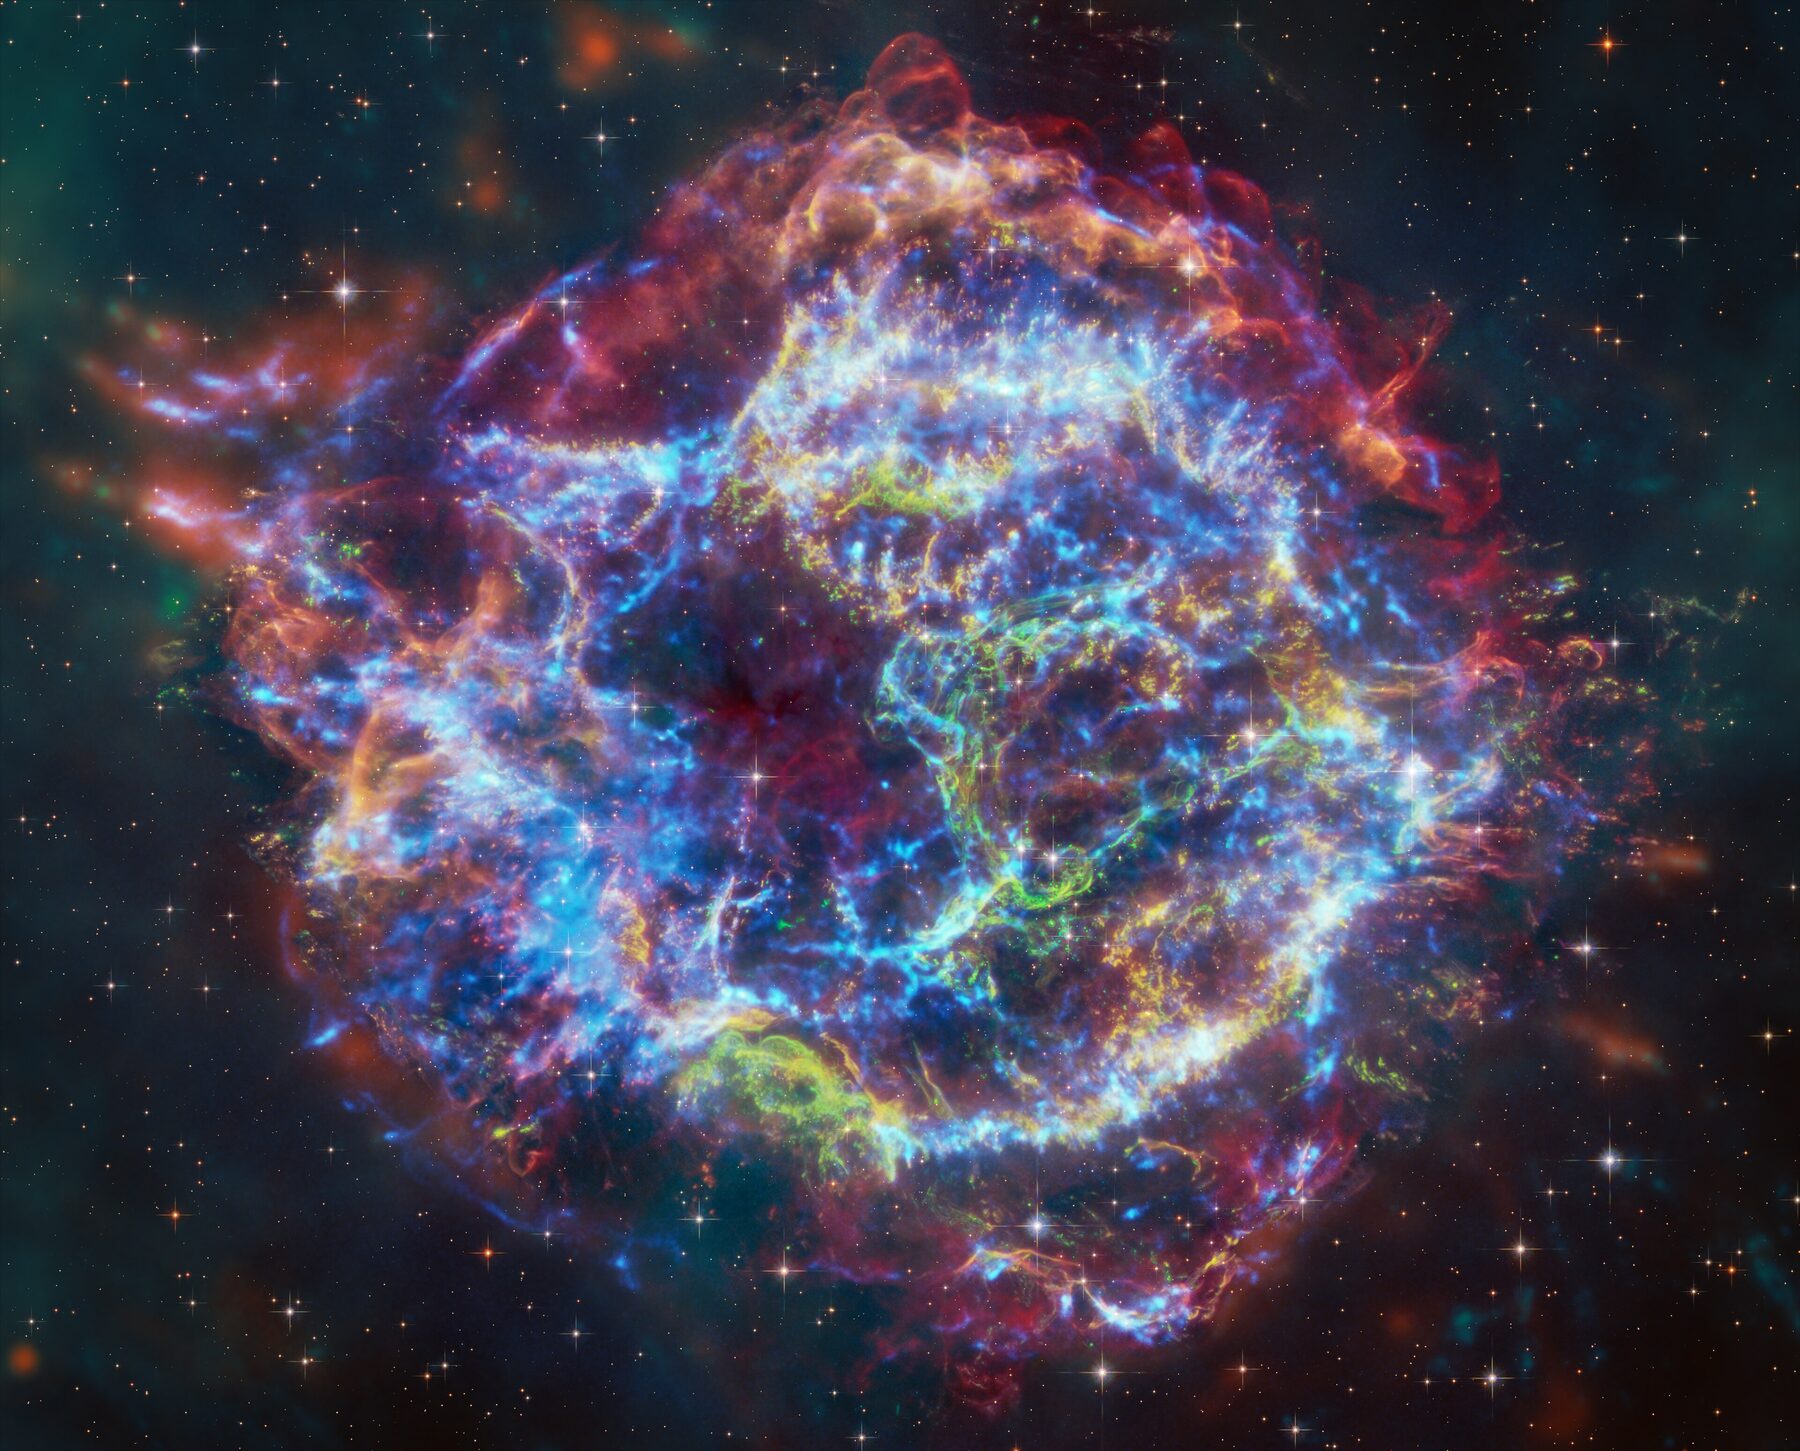
Cassiopeia A — X-ray: NASA/CXC/SAO; Optical: NASA/ESA/STScI; IR: NASA/ESA/CSA/STScI/Milisavljevic et… · public domain

Research figures (Part IV) — R. C. R. de Lima and collaborators; Coelho et al., A&A 599, A87 (2017); de Lima et al., ApJ 889, 165 (2020)

P–Ṗ diagram — ATNF pulsar catalogue 2.8.1 (Manchester et al., AJ 129, 1993, 2005)

Orbits around Sgr A* — Gillessen et al., ApJ 837, 30 (2017); GRAVITY Collaboration, A&A 657, L12 (2022)

Thank you

Questions?

Slides, animations and dashboards available at rafael-lima.pages.dev/talks

Rafael C. R. de Lima

rafael.lima@udesc.br·rafael-lima.pages.dev

Notes