SCARLET · TeV–PeV
Neutrinos, antineutrinos
and inelasticity
Structure-function model dependence of the inelasticity of TeV–PeV neutrino interactions and of neutrino–antineutrino separation in neutrino telescopes
Outline
Four parts
IceCube
What the detector measures and how composition enters the analysis
DIS
Structure functions and the separation of ν and ν̄
GENIE and SCARLET
Models, implementation and constraints from data
Results
Composition shifts, kinematic origin and statistical scale
Main question
Similar means, different compositions
How much does the inferred ν/ν̄ composition change when we change the interaction templates?
The shift depends on both the template difference and the remaining separating power.
I
Part I
IceCube
Light in ice and flux composition without a lepton-charge measurement
The observatory
A cubic kilometre of instrumented ice
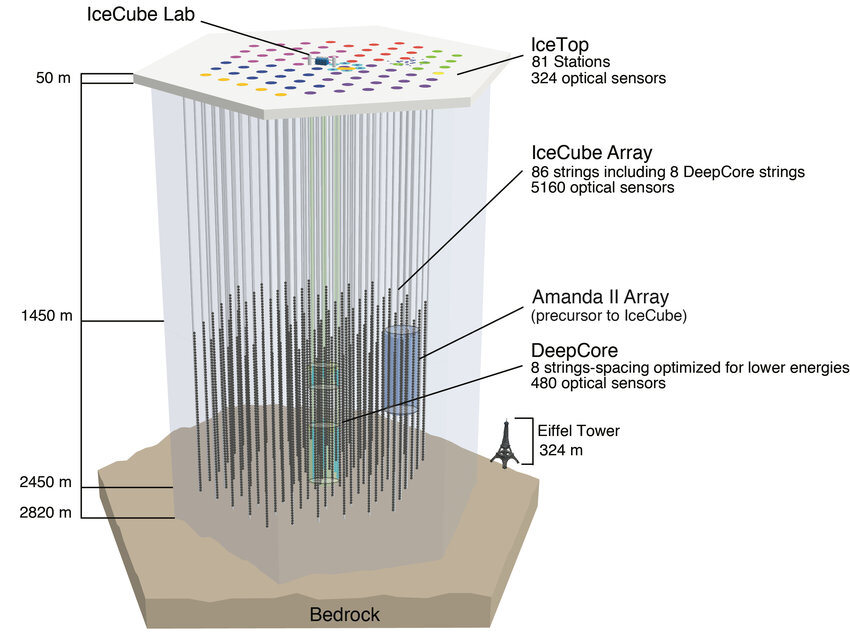
5,160 optical modules on 86 strings.
Sensors at depths of 1,450–2,450 m.
Charged particles produce Cherenkov light. Signal times and intensities constrain the event geometry and energy.
Charged-current interactions
The cascade and muon share the energy
The hadronic cascade receives approximately yEν. The muon receives (1 − y)Eν.
The detector measures light and reconstructs energies. The μ−/μ+ charge is unavailable event by event.
Visible energy
True and reconstructed inelasticity
κ represents the cascade response. Migration and selection enter the forward fit.
The motivating measurement
IceCube already uses inelasticity
5
years of contained events
1–100 TeV
approximate inelasticity measurement range
0.77
flux ratio relative to HKKMS, with +0.44/−0.25
Sensitivity to the atmospheric ratio comes from 770 GeV–21 TeV.
Three distinct quantities
Interaction fraction, event fraction and flux ratio
| Quantity | Definition | Ingredients |
|---|---|---|
| f | ν̄ fraction of CC interactions | True distributions at fixed energy |
| fev | ν̄ fraction of selected events | Fluxes, cross sections and response |
| r | Scale on HKKMS Φνμ/Φν̄μ | Joint fit with flux nuisances |
A shift in f does not translate directly into the same shift in r.
II
Part II
DIS
Structure functions determine the distributions that separate ν and ν̄
Kinematics
The domain of Bjorken x and Q²
x measures the nucleon momentum fraction sampled by the interaction. Q² sets the resolution scale.
CC cross section
F₂, FL and xF₃
× [F₂(1−y+y²/2) − FLy²/2 ± xF₃ y(1−y/2)]
The xF₃ term changes sign between ν and ν̄. Positive FL suppresses the high-y tail.
Expression without lepton-mass and target-mass terms. The calculation uses each configuration’s prescriptions.
Analytic illustration
Helicity and the y distribution
+ R(y − y²/2)
R = +1: a flat distribution.
R = −1: a distribution proportional to (1 − y)².
Mixtures
Composition depends on the templates
The two distributions approach each other as energy increases. The same change in f then produces a smaller shape change.
Bias mechanism
Separation enters the denominator
δν and δν̄ are the true mean shifts relative to the template means.
As separation decreases, a small shape mismatch can shift the composition substantially. The full fit uses the entire distribution.
Dipole description
The boson fluctuates into a quark pair
Current wave functions determine the coupling to the pair. The dipole cross section describes its interaction with the target.
BGK includes DGLAP evolution of the gluon. This work uses a HERA fit and three matching prescriptions.
Sea matching
A window between two descriptions
w = 1 − t²(3 − 2t)
t = ln(x/0.01)/ln(10)
Below x = 0.01, the dipole part. Above x = 0.1, the conventional description.
Tier 1 preserves the dipole shape inside the window. Tier 2 tests the blend and conventional shape.
III
Part III
GENIE and SCARLET
A common implementation for structure functions and inference
Architecture
The roles of GENIE and SCARLET
| Layer | Role |
|---|---|
| GENIE R-3_06_02 | Channels, kinematics and event-generation infrastructure |
| SCARLET · scarlet_physics | Wave functions, dipoles and structure functions |
| SCARLET · scarlet_genie | Adapters for the GENIE DIS and charm algorithms |
| SCARLET · analysis | Integration, templates, controls and composition fits |
GENIE remains a dependency. The adapters replace algorithms through configuration.
Configurations
One reference and three dipoles
| Model | Construction | Status |
|---|---|---|
| HEDIS / NLO | HERAPDF1.5 + APFEL | External reference |
| Tier 1 | BGK + valence subtraction + dipole shape | Admitted by the relative criterion |
| Tier 2 | Same BGK, blend and conventional shape | Variations failing the pull condition |
| Bodek–Yang | GENIE conventional structure functions | Separate comparison |
“Family” includes NLO and the three dipoles. Bodek–Yang is separate.
Reach of the data
Data constrain other scales
| Data set | x | Q² (GeV²) | Role |
|---|---|---|---|
| HERA | ≤ 0.01 | ≤ 650 | Dipole fit |
| NuTeV | 0.015, 0.045, 0.08 | 1–48 | Candidate discrimination |
| TeV–PeV predictions | Multiple regions | ~10²–10⁴ | Evolution and matching |
The prediction requires extrapolating the fitted inputs. The study quantifies differences between those prescriptions.
Selection and history
Tier 1 passes by a narrow margin
| NuTeV | χ²/N (x ≤ 0.1 / all x) | Largest pull |
|---|---|---|
| Bodek–Yang | 2.18 / 2.29 | −5.5σ |
| Tier 1 | 1.67 / 1.68 | −2.77σ |
| Tier 1 without 1.032 | — | −4.1σ |
| Tier 1 without radiation | — | −4.3σ |
The criterion was revised with results already known. The factor 1.032 entered with that revision.
NLO reference
HEDIS remains an external reference
| HEDIS variant | NuTeV χ²/N | CCFR χ²/N |
|---|---|---|
| Nominal | 2.54 / 2.87 | 5.23 / 3.85 |
| × 1.032 | 2.72 / 3.06 | 5.23 / 3.85 |
| Iron factor | 2.90 / 3.00 | 2.43 / 2.29 |
| Iron × 1.032 | 3.09 / 3.20 | 2.43 / 2.29 |
The nuclear factor improves CCFR and worsens NuTeV. Every variant fails the NuTeV criterion.
Charm treatment
An inverted propagator in G18
The cross-section effect is ≤ 0.4% up to 1 TeV, but grows when extrapolating G18. HEDIS does not use this model.
The comparisons use charm consistent with each configuration’s structure functions.
IV
Part IV
Results
Similar shapes, loss of separation and composition shifts
Distribution in x and Q²
The kinematic domain changes with energy
Tier 1, νμ, water. Cross-section fraction per 0.25 × 0.25 decade cell.
x < 0.01: from 3.1% to 55% between 1 TeV and 1 PeV.
The occupancy map does not isolate saturation effects.
Separating power
Δ⟨y⟩ falls from 0.12 to 0.008
The ν–ν̄ separation decreases far more than the spread of model means.
Within the family, the means differ by at most about 0.005.
Solid lines: ν.
Dashed lines: ν̄.
Shape fits
Small differences shift the fraction
Templates of A fitted to the expected mixture of B.
Maximum over ordered pairs and f = 0.15–0.50, with 20 bins in y.
The physical fit uses 0 ≤ f ≤ 1. Large high-energy shifts accompany a loss of information.
Identifiability
A large bias can occur without a poor fit
2.4
σf√N at 1 TeV
31
σf√N at 1 PeV
≤ 1.2
deviance for 18 degrees of freedom at exposure Nbias
At the exposure where |δf| equals the statistical error, goodness of fit may not reveal the shift.
Implementation controls
Common targets and cuts
| E (TeV) | Nominal | Free nucleons | + W > 2 GeV | + Q² > 1 GeV² |
|---|---|---|---|---|
| 1 | 0.026 | 0.021 | 0.030 | 0.023 |
| 3 | 0.026 | 0.019 | 0.021 | 0.017 |
| 100 | 0.065 | 0.049 | 0.049 | 0.048 |
| 1000 | 0.438 | 0.318 | 0.318 | 0.317 |
Maximum |δf|, Tier 1–NLO. Cuts matter at low energy. Nuclear treatment explains part of the high-energy difference.
Regional decomposition
Contributions in x can cancel
Fixed comparison: NLO templates fitted to a Tier 1 mixture with f = 0.25.
Up to 30 TeV: |δf| ≤ 0.019 with cancellations.
Matching dominates at 100 TeV. x < 0.01 dominates from 300 TeV.
Observational comparison
The current measurement does not distinguish the models
All predictions lie within 0.6 times the IceCube 68% half-interval.
Differences from the reference: ≤ 0.004 within the family and ≤ 0.011 for Bodek–Yang.
The chart shows the five visible-energy bins.
Comparison validation
The forward fit preserves the result
| Test | Result |
|---|---|
| 5 models, 11 responses, Asimov | FF − E1 = −0.003 … +0.004 |
| Change in model differences | ≤ 0.0006 |
| 300 pseudo-experiments per model, bins 1–4 | Bias ≤ 0.001 |
| Open bin, ~8 events | Bias up to 0.014; ~50% at boundaries |
The real IceCube response remains outside this test.
Detector level
The fit includes flux and response
Atmospheric and astrophysical fluxes, veto, Earth absorption, energy resolution and track selection.
Acceptance was calibrated to IceCube counts after a first Asimov run had already shown the biases.
Calibration changes the shifts by less than 0.01 in r.
Flux ratio
Shifts of 8% and up to 18%
| Truth ← templates | δr | Shape part |
|---|---|---|
| NLO ← Tier 1 | −0.056 | −0.025 |
| Tier 1 ← NLO | +0.065 | +0.030 |
| NLO ← Tier 2 conv. | −0.107 | −0.081 |
| Tier 2 conv. ← NLO | +0.139 | +0.103 |
| NLO ← Bodek–Yang | +0.033 | +0.091 |
Asimov, r = 0.77. Tier 1–NLO: roughly half from shapes and half from cross sections and absorption.
Statistical scale
Exposure makes the difference relevant
The error is asymmetric. The comparison uses the biased fit half-interval towards the true value.
×10 keeps the same response. It is not a specific Gen2 forecast.
Fit validation
Closure and coverage have distinct scopes
| Diagnostic | ×1 | ×10 |
|---|---|---|
| Estimator r̂ | Upward bias of 6–10% | Diagnostics in ρ = ln r |
| Closure in ρ | Fails; |bias| ≤ 0.035 | 0 failures in 65 tests |
| Profile coverage | Not evaluated | 68.30 ± 0.23% / 95.01 ± 0.11% |
ρ = ln r was adopted after the failure. The transformation preserves the maximum and maps the interval.
Interpretation limits
What the results establish
Differences between prescriptions
The family is finite and shares inputs. Its envelope has no probabilistic coverage.
Complete configurations in the detector
Nuclear and normalisation effects have not been separated at this level.
Inference in a proxy
The tests do not establish a bias in IceCube’s measurement or validate its real response.
Conclusions
Composition inference requires testing the distributions
Similar means do not guarantee stable inferred composition.
0.12 → 0.008
decrease in ν–ν̄ separation
8–18%
r shifts within the family, in the proxy
0.8–1.6
times the profile error at ×10
Sources and credits
References and data
This work
R. C. R. de Lima and B. D. S. Moreira
Structure-function model dependence of the inelasticity of TeV–PeV neutrino interactions and of neutrino–antineutrino separation in neutrino telescopes
Manuscript in preparation, 30 October 2026 version.
IceCube
Phys. Rev. D 99 (2019) 032004
arXiv:1808.07629
icecube.wisc.edu/science/icecube
Models
CSMS: JHEP 08 (2011) 042
BGK: Phys. Rev. D 66 (2002) 014001
GENIE and HEDIS: manuscript references.
Images and numbers
IceCube Lab: John Hardin, CC BY 4.0.
Detector: K. Andeen and M. Plum, CC BY 4.0.
Study charts: SCARLET outputs, provenance in assets/data-sources.json.
SCARLET · TeV–PeV
Questions?
Inelasticity, composition and structure-function dependence